Chapter 4: Mapping Density
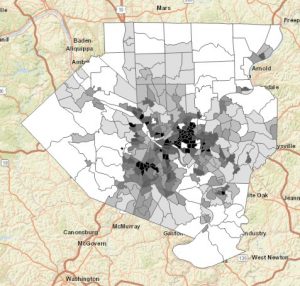
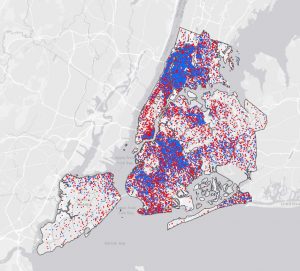
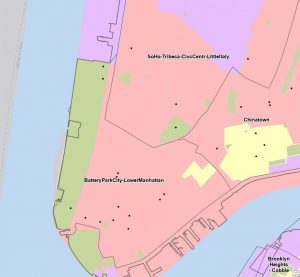
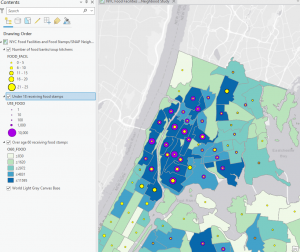
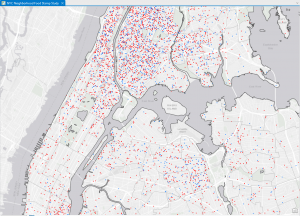
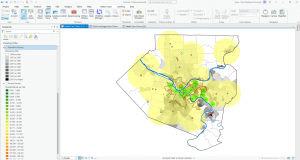
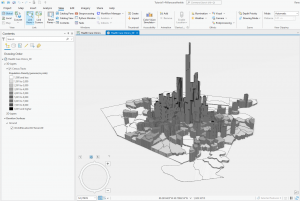
Why would somebody want to map density? People map density in order to see the highest and lowest concentrations of certain features. This is done mainly to see some patterns rather than where these features are. It is easier to see density with different colors than using points on a map. There are 2 key approaches to mapping density, creating shapes through a density surface. And using a defined area, through either using a dot density map or through a shade based on a determined value. It is very important to keep the units consistent. When creating a dot map, it is important to have a decent conversion rate for the data. Such as 1 dot for 200, but this does sacrifice accuracy as instead of an exact location, the dot will go in the general area of the features. With the dots themselves, it may be keen to change how the dots look in order to exemplify a pattern, mostly through the method of sizing up or down the dots.
Key Takeaways:
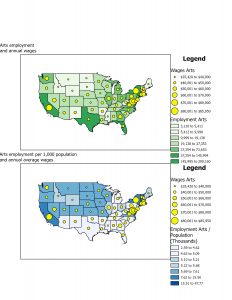
- Calculating the density value for inconsistent units
- pop_density = total_pop / (total area / conversion ratio)
- The reason for 27878400 is that is the total square footage in a square mile. So if I wanted to turn square footage to square mileage…
- Population density = total population / (total area in greater units / 27878400)
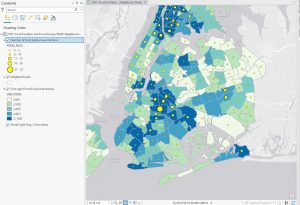
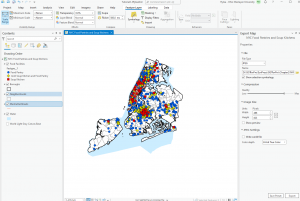
- The Balancing Act of Dots: The less a dot represents, the more exact the area will be, but the map will be full of clutter. There is a balancing act between amount & size to adequately show the desired pattern & data.
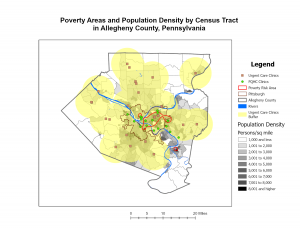
- Search Radius: The larger the radius, the more generalized the patterns & density.
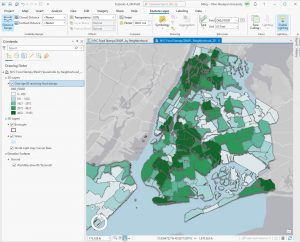
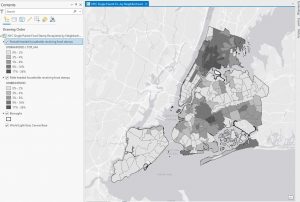
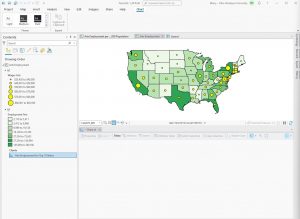
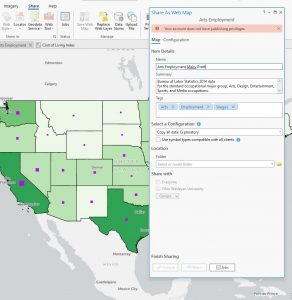
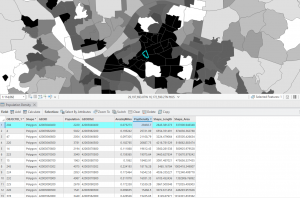
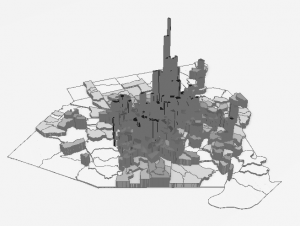
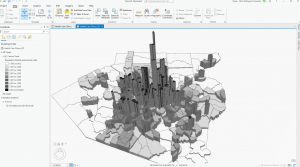
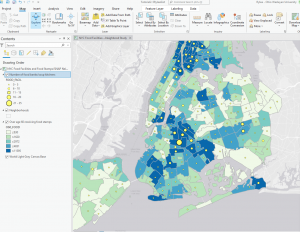
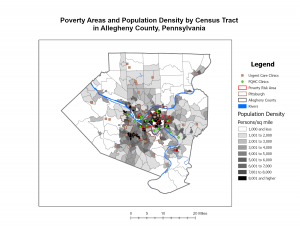
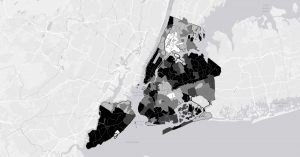
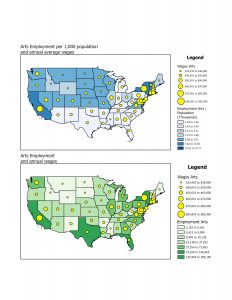
- Displaying density: We can use either graduated colors or contours in order to display density.
- To display the best amount of contour is a black, light gray, or white for 0, and a color as anything within the displaying pre-requisites.
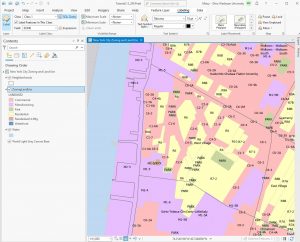
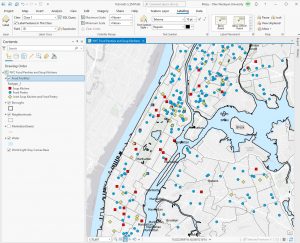
Chapter 5: Finding What’s Inside
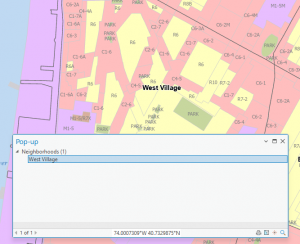
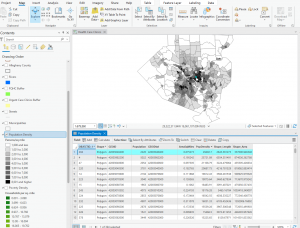
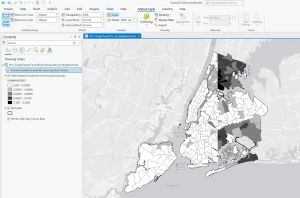
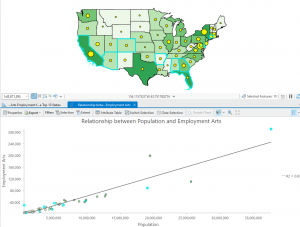
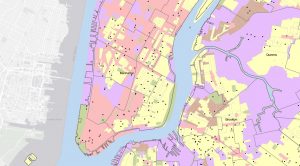
People map what is inside in order to compare several areas based on the interior of them. While seeing a pattern is important, providing information on what is inside of the mapped area can provide a crucial amount of context. If this were to be used for something similar to an official proposal, there may be explanations that are answerable by the context provided by the map. Why would there not be any sales data for a large amount of land within a town? There may be a large parcel of land owned by 1 person for a farm. Are features discrete or continuous? This can be crucial for the context that an interior map provides. The cartographer will also need to answer the question of what features deserve documentation. We may use different methods such as the raster method to take in information about the area that we have selected and overlay different sets of data over each other in order to get a result regarding the different sets of data that we are using for this location to see patterns. We can then use the information generated to either make a map using it or different types of charts hat display a few of the key indicators together.
Key Takeaways:
- Discrete vs Continuous features:
- Discrete features are unique & identifiable. These can be listed & counted. Some examples are addresses, towns, buildings, crimes, or known locations of animals.
- Continuous features: Supposed to represent a seamless geographic feature. This can be elevations, sea levels, climates, etc.
- Count v frequency:
A count would be the knowledge of how many features are inside of a total area, whereas frequency would be knowing how many of a counted feature is inside of an area.
Usage of the Raster Method: Using a combination of raster layers to compare each part of the cell with categories. It will then come up with an end result of some sort to put in the table. This is typically the most efficient way to display overlapping features.
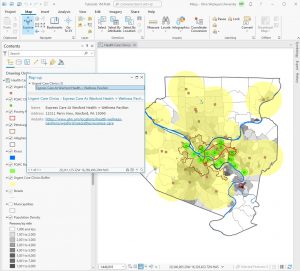
Chapter 6: Finding what’s nearby
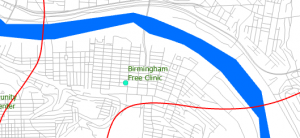
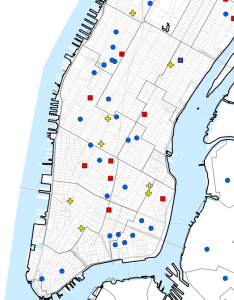
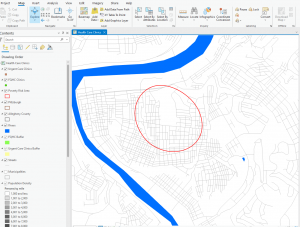
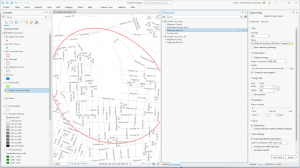
People usually want to find out what is nearby in order to use the patterns generated by the data to predict what may come up in the future due to various conditions being tracked. This is called the travel range, which can be measured through either time, distance, or cost. This information can be used to decide what to do & potential ways to combat potential problems that come up in the future. This is typically done by showing what is near by the area that is mappeed using methods used in chapters 2-5. Within the three key ways that I have listed, which are straight line distance, distance or cost over network, and cost over surface, once we have picked whatever method works the best, we can create a buffer to see what is within the distance through the method that we have chosen. There are several methods to measuring this distance through maps, such as point -> point, using color codes, or spider diagrams. Having a lot of data for this type of map is key, and needs to be gathered & separated accordingly to the needs of the maps.
Key Takeaways:
Three key ways to measure what is nearby:
Straight line distance: Used to see what is around the selected feature using a distance in order to create some sort of boundary or see what features are within said distance.
Distance/Cost Over Network: Measures travel based on things such as roads, typically used to see the cost/distance of travel between two+ points.
Cost over surface: Measures overland travel, such as a plane, to see the area within a range based on different costs.
Rings: Typically used for finding how much a value of features increases/decreases as the distance covered increases/decreases.
Buffer: Typically used to create a boundary of some sort, there may be multiple.
Bands: Good for usage in comparing distance.