Chapter 1:
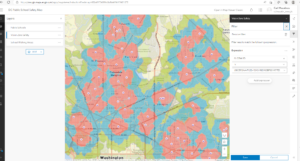
I found chapter one to be pretty simple and straightforward in ARCOnline and was able to create all of the maps except one of them. I had a bit of trouble finding my information/data for the request and speeding map. This was the only issue that I had in this chapter and I think it is due to either my initial link to the data got messed up or the information was in the wrong place so I could not find it.
Chapter 2:
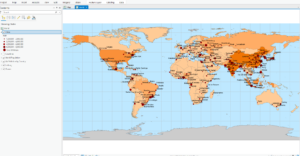
I would say this is the easiest one that I have done so far because I have also done this in a separate class with Krygier. I have done a lot of work in ARCPro now so finding where the toolbox is and the location of all the functions are pretty easy to find for me. For some of the measurements and population numbers I found the largest population, China to be 14,608,512. I was also able to get a couple of distances from the measure function so the distance between Toronto and NYC are 350 miles and Calgary to Toronto is 1627.86 miles.
Chapter 3:
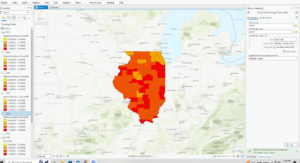
This Chapter was going well until I got to the shapefile step because when I went to input the shapefile into the map there was no Shapefile to be found. The steps leading up to the shapefile went well, I was able to see the fips codes and how they divide each state, county and town up with different number codes. Below I have the catalog open in ARCPro where the shapefile should be, I am not sure why it is missing from the folder but this could be because the folder link to the map was incorrect or the file is in a different location.
Chapter 4:
I feel like I have not linked any of these chapters correctly in ARCpro because everything was going well in the chapter until I got to open the attribute table and found that there was no domain section in the table view. Because the rest of the information is in the table I believe the table must have had a screw up because every other section is found in the table but the one DOMAIN section I was looking for.
Chapter 5:
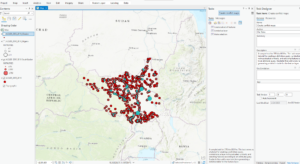
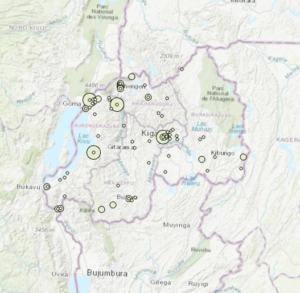
Some of the information found here are things like fatalities, thefts, riots and protests and this was also another easy chapter to get through. I believe I did 5b a little wrong because I see more points on my map then I do in the book but the function behind the data was pretty easy to follow. I will definitely be using these attribute table skills on my projects later on this semester.
