- Hello, my name is Nathan Sturgill but I prefer to be called Will (my middle name). I am a senior this year and I am a double major in Environmental Studies and Geography. I am from Portsmouth, Ohio, which is in Scioto County (roughly the southern tip of Ohio). My interests include skiing, golf, and wakeboarding. This will be my second class with Dr. Krygier, and I am looking forward to having a great semester! I plan on becoming the remote sensing lab student manager for the year. I also live in one of the fraternities here on campus with a great group of guys. My goal for this class is to become more skilled with GIS and to have a better understanding of the history behind GIS.

- 2. Reading Schuurman chapter 1 was very helpful in understanding the origins of what makes up GIS. GIS consists of two specific uses which are making maps and analyzing data. I had no idea there was such a debate in the GIS community as to what really makes up GIS and which of the uses is the real identity of GIS. GIS is viewed by some to be just a tool or application that is used for creating visual representations of maps and mapping data. Many others it is viewed as being an analysis of spatial data that includes creating visual maps with many different layers and factors besides just a basic cartographic map. The debate between the two was also referred to as GIS as in Geographic Information Systems and GIS as in Geographic Information Science. I thought that the most interesting difference between the two meanings for GIS was how the chapter articulated the difference. The chapter states that the science in GIS asks the question of how versus the system in GIS is where the spatial entities are. I had never thought about the difference in GIS or had even known if there was a difference in what GIS meant to the Geography community. I also thought that how the chapter explained what visual representation can mean to people when analyzing data was very interesting in that many people do not realize how they interpret visual representation compared to numerical data and cartography.
- I searched “GIS application urban expansion” and the first article that caught my attention was Characterizing and classifying urban watersheds with compositional and structural attributes. This article caught my attention because I have always been interested in urban expansion and how it affects the natural environment around us, and how we as humans contribute towards the degradation of natural environments via urbanization. This article explains the distribution of land cover, topography, infrastructure, and topography across a certain region in North Carolina. This article explains the rapid growth of urban expansion in the Southeastern region of the United States and how it affects the natural environment of the area using GIS to measure this effect. The article states that development threatens water resources in the region which in turn threatens water resources and further development of the area. This is fascinating to me because it explains how the region has suffered with poor water quality due to urbanization and the continued growth of urban communities in the area.
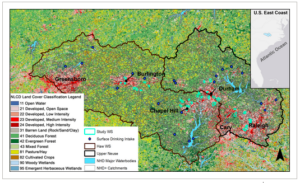
- This figure represents the study area of the region and how the area is affected by urban expansion compared to the surface water resources shown in blue dots.
https://onlinelibrary.wiley.com/doi/full/10.1002/hyp.14339
- Another article I found under “GIS application urban expansion” mentioned streams in urban heat islands and the variability in temporal and spatial temperatures. This article examines how streams that drain urban heat islands are warmer due to urban air temperatures and ground temperatures, and paved impervious surfaces that the stream may run across. This article really interested me because it shows one of the main negative consequences (using GIS to do so) of urban expansion and what urban expansion can really do to the environment. The article also explains how urban heat islands are created and how they differ in temperature from rural, and forested areas. The main reason urban areas tend to have higher temperatures than rural and forested areas is because impervious surfaces used to create infrastructure as well as a lack of natural vegetation in the area which decreases the cooling effect for the area.
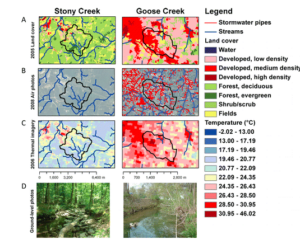
- This figure represents a comparison between a rural area and an urban area in North Carolina. Stony Creek being the rural area and Goose Creek being the urban area. The biggest difference between these two is the obvious difference in temperature for the two regions. We can also see how the forested area directly correlates with a lower temperature of the area observed, and how the urban area directly correlates to a higher temperature recorded for the area. We are able to tell this correlation between areas and temperatures because of the GIS application that is used here to observe and take these measurements.
- https://www.journals.uchicago.edu/doi/full/10.1899/12-046.1
I changed all the text from Heading 2 to Paragraph. It was too big and scary. I had to look up wakeboarding. Boarding in the wake of a boat.
Good applications!