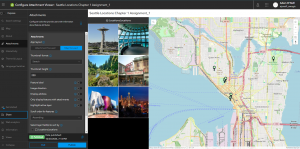
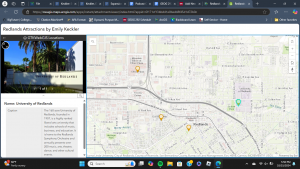
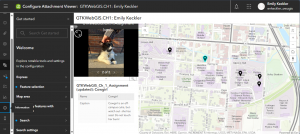
Chapter 1: I at first found some of the information at the beginning of chapter 1 to be a little bit repetitive after taking the intro course for week 1, but I thought some of the applications were really cool demonstrations of what ArcOnline can do (such as with the COVID tracking app). The step by step tutorials included in the book were very helpful in guiding me through creating maps and app. However, I did have one question while working on section 1.3: What is a ‘Community Map’? I didn’t have one listed as an option for a basemap, which left me a bit confused and I opted to leave the basemap as topographic. I initially ran into another issue in 1.4 where the words “No attachments found” appeared in place of the attachments for the ESRI location, but later realized the .jpg attachment had somehow removed itself. Overall, I found the tutorial easy to follow and the program pretty straightforward, I will just need a little more practice to feel confident in doing these tasks myself.

Chapter 2: This section reminded me of working on the symbology in the Geog 291 class, so the similarities made it easier for me to understand. I found the tutorials easy to follow and thought it was satisfying to watch the map and pop-ups look cleaner the further into the tutorial I got. The only issue I had in completing this section was that I realized I mixed up the labels for Median Household Income and Median Home Value and had to backtrack to correct my mistake. The second half of this chapter that focused on StoryMap making was especially familiar because I already created a StoryMap for Geog 291. However, it was still helpful to review all the functions.


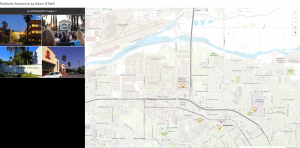
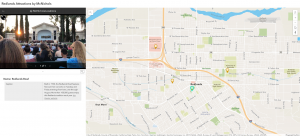
Assignment: One of the suggestions under the assignment section on page 35 of the GIS book is to create an app that highlights places that you’ve visited on a recent vacation, which I think sounds like it could be really cool. Last summer I went on a trip with my parents to Montréal, Canada, during which we visited a number of significant landmarks and interesting locations. I think incorporating these points of interest into an app would be a good way to represent the potential of ArcOnline app making while still pertaining to my personal interests in travel.