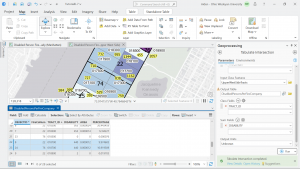
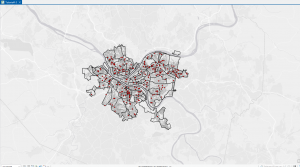
Chapter 4
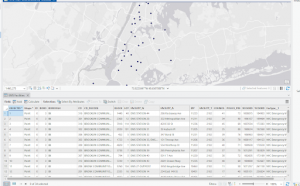
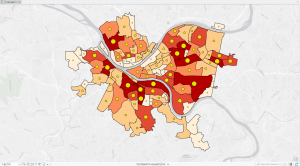
In chapter 4 I learned about modifying attribute tables, carrying out attribute queries, aggregating data with spatial joins, using central point features for polygons, and creating a new table for a one-to-many join. I started this chapter off with no problems and it was pretty easy to follow along. I had troubles with 4-2 when trying to delete rows from the attribute table. An error message would pop up when I tried to save it and I even went to the website which gave me suggestions to fix it and I still couldn’t figure it out. I skipped the chapter but the next day I went back to it and somehow got it to work and finished the chapter. The rest of the chapter was interesting and took some time but I got it all figured out.
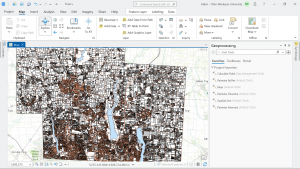
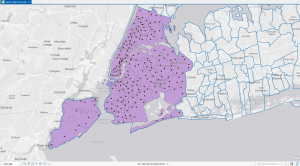
Chapter 5
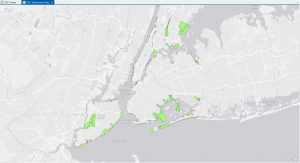
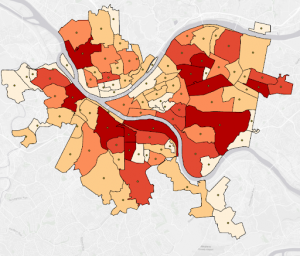
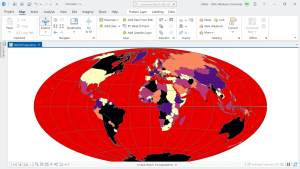
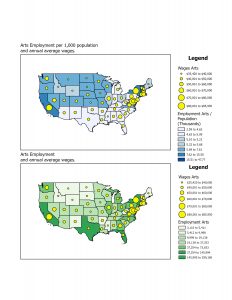
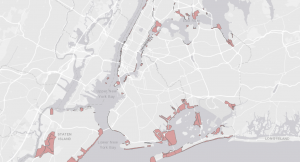
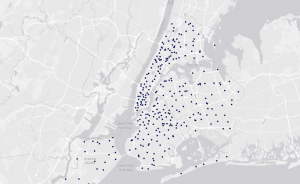
Chapter 5 was about working with map projections, coordinate systems, vector data formats, US Census maps and data tables, and finally how to download geospatial data. I enjoyed exploring the different map projections and coordinate systems to see how it affected the map. Working with the US Census maps and data tables gave me a little trouble and I ended up messing up the final product. When working with the bicyclist data between male and females I made a mistake. The data files were already supposed to be in percentage form but they were not so I must have made a mistake at some point. I did go back but I am not sure where I made a mistake. I still finished the tutorial but it wasn’t correct and I wasn’t able to see a pattern between the Male and Female bicyclists. I had a few other problems but with some quick google searches I got them figured out. I realized during this chapter that I was becoming much more familiar with where things are and the tutorials weren’t taking as long.
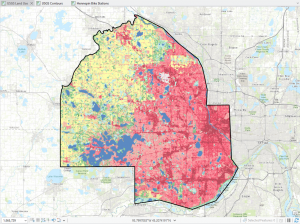
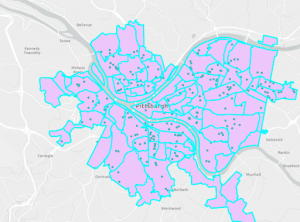
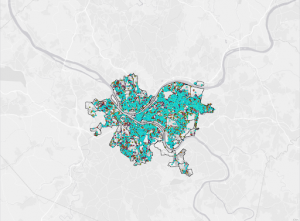
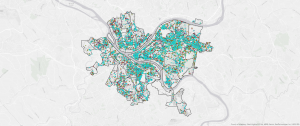
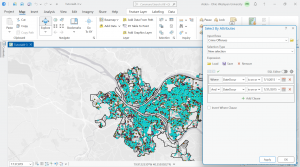
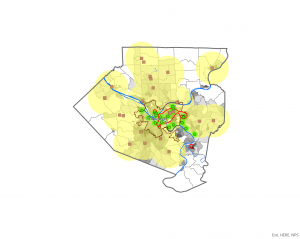
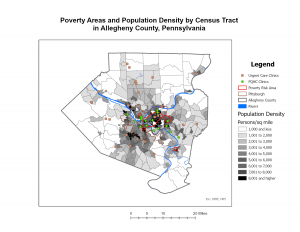
Chapter 6
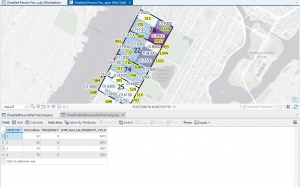
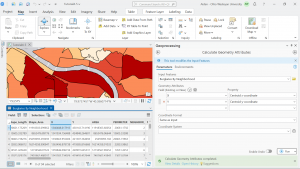
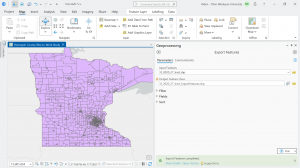
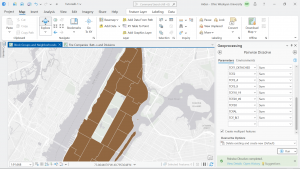
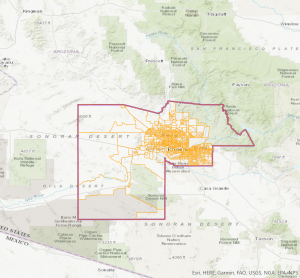
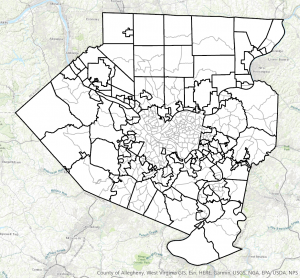
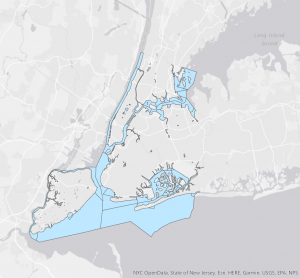
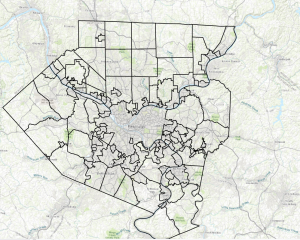
Chapter 6 included dissolving features, extracting and clipping features for a study area, merging features, intersecting features, using union on neighborhoods and land-use features, and Using the tabulate intersection tool. I was able to get through this chapter pretty quickly. My only problem was in tutorial 2, where I was extracting and clipping features for a study area. After I selected groups by area, I was supposed to select the remaining block groups with the selection tool but every time I tried It would deselect the other groups. I had to redo the whole process multiple times and I still couldn’t figure it out so I had to move on. By the end of this week I feel more comfortable with the interface but there is still a lot that confuses me.