My name is Mia Butte, I am a freshman at OWU who is planning on doing a double major in Film and Biology (possible to change to Environmental or Earth Science). I am highly interested in Paleontology so I wished to study Geology- but as it’s not offered anymore, I plan on taking similar courses with an alternate major to fulfill this interest. I am a commuter from Lewis Center, and have a passion for all creative arts as well as evolutionary and paleosciences. I hope that I can find ways to bridge art and science during my time at Wesleyan. 
After reading the chapter the biggest takeaway for me, in connection with my interests, is the direct use for archeological sites and research. This was both something I knew about when entering the class, and the main reason why I decided to learn the skill. That being said, the reading provided much more information as to what GIS actually is and how it’s used as a tool. I learned that GIS sort of developed through technological evolution- that GIS was developed as a collective of similar research from many different locations. It also wasn’t initially made with Geography in mind, but rather for Architecture and population censuses, which I thought was interesting. One thing that surprised me was how many different uses the system has, spanning across all kinds of fields and daily encounters. I didn’t realize it was something that was actually used every day rather than for specialized projects/ research. For example, city development plans have to account for where certain buildings and facilities are built, using GIS and data points to map out the best areas for construction. But it can also be used to map out GPS and routes on everyone’s phones/ vehicles. It’s also interesting that there are so many different interpretations of GIS, between being GISystems vs. GIScience (and viewing it with a scientific approach), and many opinions on the “correct” definition or use. Whatever the opinion is, it remains the fact that GIS has many different levels to it, varying between each field of use. To put it simply, GIS is the visualization of data, turning tables and numbers into easily understandable maps. Most people I told about this class were confused and said GIS was something that they had never heard of before. They might recognize a map or GIS application, without understanding its meaning or use towards their lives. This chapter helped me develop a deeper understanding of these systems myself so that I can better explain its concept and uses to those who are initially confused, but interested in learning more.
GIS Applications:
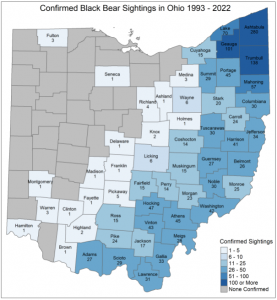
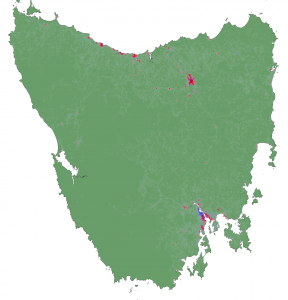
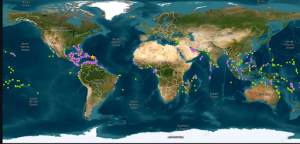
I have always found it interesting that there have been bear sightings in Ohio, considering the landscape here. This GIS map report shows the amount of sightings since 1993, and the regions they can be found in.
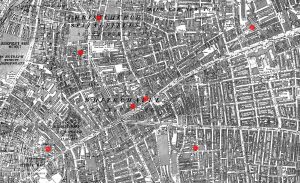
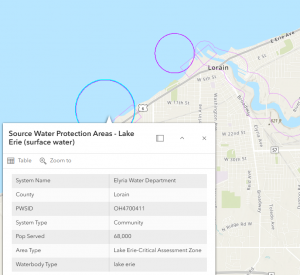
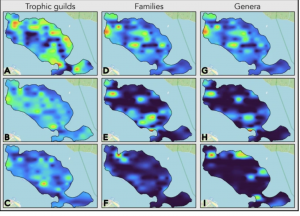
Similar to the last application, this map follows sightings of an animal thought to have been extinct in Cleveland since the 1800s, but has recently made a comeback.

Lastly, I completed the quiz!


 Introduction: