Chapter 9
The first few tutorials went well. When I got to 9-3, I couldn’t calculate the fields for UseRate. Only a couple of the values worked. I tried some stuff and nothing helped so I just moved on. I also struggled to make a scatterplot because I couldn’t find the chart properties button and I gave up looking for it. The rest of the chapter went well and was pretty quick.
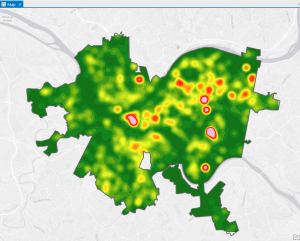
Chapter 10
I really enjoyed doing the contours and things in this chapter. It was very enjoyable. The only issue I had was that the PovertyIndex.lyrx wasn’t downloaded into my folder, so I couldn’t add that to my map. Other than that, everything went smoothly.
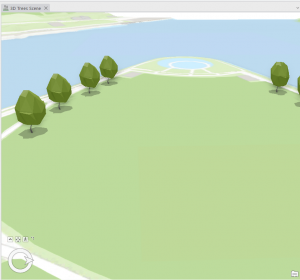
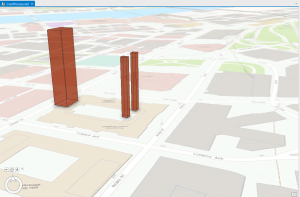
Chapter 11
In 11-4 I had trouble adding Z as the field for the summary statistics tool. After that the rest of the tutorial got weird so I moved on. Other than that it went really well. Making the animation was cool, and not something I expected to be doing!
Delaware Data Inventory
The process for this was super simple it just took forever to download everything to my folder.
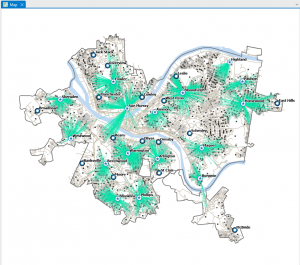
Hydrology: contains all major waterways in Delaware
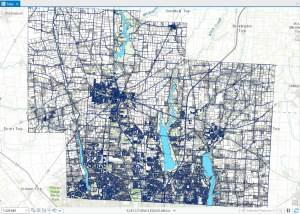
Street centerline: contains public and private paved roads in Delaware
Parcel: contains property lines for Delaware (makes sense why this one took so long to download haha)
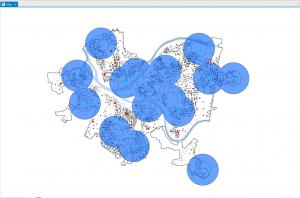
I couldn’t figure out how to add the stuff to a map but I’ll figure it out and add the map image to my post next week!
Update: I figured it out lol