Chapter 4:
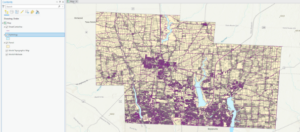
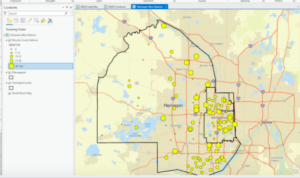
I ran into some issues at the beginning of chapter 4. I had no problem making the folder connection and converting the shapefile to a feature class. This main issue began when there was no Tracts feature class under YouthPopulation.gdb. Another issue I ran into was that I did not have Tracts in my content pane. This meant that I had trouble doing the majority of tutorial 4-2. The tutorials afterwards had much less issues. I thought that the select by attributes tools was interesting and a good way to narrow down larger data sets to find exactly what you are looking for. I was really impressed with when the Select by Attributes tool was used to figure out who may have committed the unsolved burglary. Another odd issue I ran into was in tutorial 3, when I changed the burglary symbol to dark red. The points still showed up as a teal color unless I was actively zooming in or out, then they would change to red. This didn’t affect my work, but was odd.
Chapter 5:
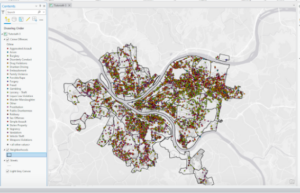
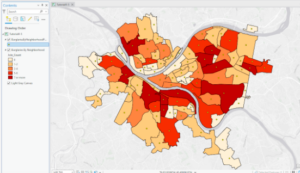
I thought that the ability to change the map from a rectangle to an oval/ more 2D sphere shape was useful. This was done by clicking properties for the map, going to coordinate system, Projected coordinate system, world, and then clicking Hammer-Aitoff(world). I’m curious what the other options under the Projected coordinate system look like. I noticed that looking at some of the zone abbreviations for Ohio cities the zone abbreviation has the state abbreviation(OH for Ohio) and then the letter after it seems to be what part of Ohio ( North, East, South, or West) the city is found. I ran into a few issues in this section but got them figured out. I found that sometimes when I downloaded data into a folder and then tried to open it in Arc, the file and data would not be there so I would have to close and reopen Arc and then I could find the folder with the data I needed to add.
Chapter 6
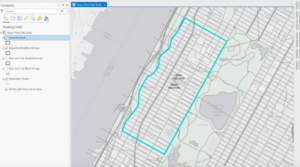
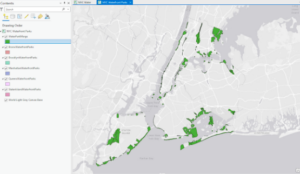
In this chapter, it introduces new tools like the Pairwise Dissolve tool and the Pairwise Clip tool. The Dissolve tool removes the inner lines from a neighborhood while maintaining the outer boundary. The Clip tool can be used to create street segments that can be added to your study area. I could not figure out how to save the Streets as UpperWestSideStreetsForGeocoding with the Select by Location tool but somehow the streets still ended up getting cut cleanly for the neighborhood. This chapter also uses the merge tool, to merge feature classes into one, and the Append tool, to add features to feature classes that already exist. I thought section 5 was cool where we intersected the Manhattan Fire Company and Manhattan Street feature classes and this allowed us to see what streets were served by which fire station. The Union tool was also introduced which allowed us to combine table data together on the map. This section seemed to go by pretty quickly and gave me fewer issues than the last chapter.
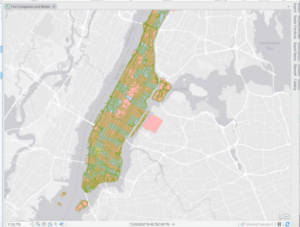
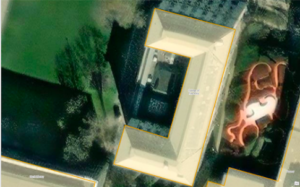
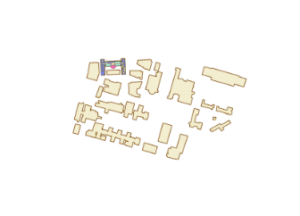
I thought it was cool that you could adjust the outlines of the buildings with the buildings by using the select tool and then move in the edit tab. I had issues getting the lasso tool to just move one point and not the whole polygon, but was able to fix the issue by selecting the stretch proportionally button. This chapter introduces the smooth Polygon tool to make the edges of the polygon more rounded instead of straight segments.
Chapter 8
I ended up having a lot of trouble with this chapter. I’m not sure if others had a similar issue, but when I was using the Create Locator tool, it would not accept the Output Locator name even when I tried to save it to different places than the book listed. This was an issue because the locator was needed to do the other work in this chapter. I met with Krygier and we still were unable to figure it out so he told me to skip this chapter.
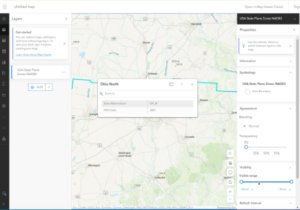
Delaware Data & Inventory : Map with 3 layers (Parcels, Street Centerlines, and Hydrology)
