1. Introduction: Hi, my name’s Haley Roberts and I’m a first-year environmental science major. I’m from Bowling Green, Ohio, which is just under 2 hours North of here. In my free time I enjoy drawing, reading, camping, and rollerskating. I don’t really know much about using ArcGIS, but it seems like a valuable skill to have in an environmental science profession, so I’m excited to learn more about it.

2. Schuurman: The first thing that stood out to me in the reading was how widespread the use of GIS is. It definitely made me rethink what I thought I knew about GIS- I wouldn’t have even considered it as something that could be applied to police training or organ donation. I think it’s really interesting how the concept of GIS was initially expressed with layered tracing paper in the ’60s. Even though this makes sense, I always associated GIS as a very modern concept used on computers with special software, so hearing that GIS dates back about 60 years was shocking. Reading about the overall timeline and evolution of GIS was also fascinating. Comparing the image in the reading of one of the first computerized GIS images to what modern technology is capable of makes me in awe of the long strides that we’ve come in technological advancement. I liked how the reading compared GIS’s impact on the quantitative revolution to the calculator’s impact on mathematics. This seems to emphasize how much more we are capable of now that we have technology that can do tasks nearly instantaneously when they used to take weeks to years. The fact that GIS is known for its ability to provide a very visual demonstration of data is neat, especially as someone who is a very visual learner like myself. After the reading I can understand just how much GIS impacts people even outside the academic communities that use it the most frequently (ex. farming and consuming farmed goods, taxes, and other uses of GIS apply to the general public). The reading also helped me realize that I’ve used GIS concepts before in other classes like CNX100 or even for personal research, I just didn’t recognize it for what it was at the time.
3. Applications: One of the applications of GIS that I kept seeing was to use it for natural disaster management. One of the examples of this that I found the most intriguing was using it to map power outages caused by hurricanes. Especially in a time where storms are, on average, steadily increasing in intensity, using GIS to brace for power outages and recognize which areas as the most frequently impacted seems like it could of great importance.
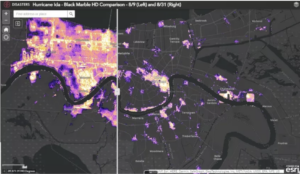
https://appliedsciences.nasa.gov/our-impact/story/evolving-gis-technologies-advance-disaster-management
Another application of GIS would be to map the movement patterns of certain animals. This article chooses to look at a species of frog in California, but despite being an older article I think a lot of the methods could still be applicable today. I could see using GIS in a similar manner to monitor the movement of endangered species or to observe whether or not a factor such as a wildfire, deforestation, or global warming impacted a species’ movement patterns.
https://scholarworks.calstate.edu/downloads/xs55mf25c