Hi there! I’m Sydney Gassert. I’m a sophomore majoring in ENVS with a strong interest in animal behavior. I was born here in Ohio, but have lived in California, Texas, and Arizona. I’ve gained a lot of experience with animals over my time in high school in Arizona, working with an organization called Fallen Feathers. While volunteering there, I worked with wild birds to be rehabilitated and rescue parrots to find new families. I currently work at the Columbus Zoo in guest relations and at a vet/pet boarding facility as a kennel tech. After college, I hope to advance at the zoo and become a part of the animal care team either in the aviaries or with the pinnipeds!
A few more little fun facts about me; I play the violin, I’m into photography, and I keep bugs as pets (that is my spiny flower mantis on my face in the pic I posted. Her name is Matcha and she’s very silly)
This chapter gave me a good refresher on what GIS is and what it can be utilized for. I’ve never used an actual digital GIS system myself, but seeing this now I remember reviewing maps of Mexican wolf populations in Arizona for one of my classes I had in high school. We were challenged to analyze the map and figure out where the different wolf packs were traveling and where they frequented based on coordinates. If GIS wasn’t popularized when it was, a lot of advancements may not have been made. Without GIS systems, it would be harder to map out and identify different regions. Many different categories of people can benefit from GIS systems to do their jobs. Architects, biologists, oceanographers, and geologists just to name a few. The fact that you can also add different layers to GIS maps to show changes over time and movement is also incredibly fascinating and helpful to give a visual of migration patterns of animals for example. I hope to gain more knowledge on how to generate and use the GIS myself to possibly help a little in my career path.

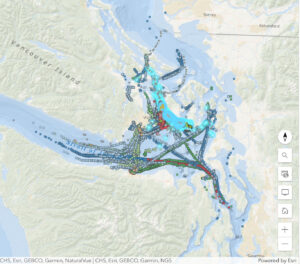
Being that I have a heavy interest in animal behavior, I decided to take a look at southern resident killer whale sightings. I have an unhealthy obsession with orcas, so why not take a look at one of the most threatened populations? All of the circular dot marks on the map mean different things like foraging, feeding, and even social interactions between the pods. The square dots on the map indicate boat travel and types of boats that sail the same areas that the SRKWs frequent. This map shows a good amount of interference between boats and the whales, which can interrupt the whales’ way of life.
https://www.arcgis.com/apps/mapviewer/index.html?webmap=226b74dc38ba46eba2e5d6317ddf0b54