I am Annabel Benes, a senior here at OWU, studying Environmental Studies and Business. I was born and raised in Denver, Colorado, I love to ski, hike and go on walks with my family and my dog Boscoe!
I took this course because I didn’t really use what GIS was and wanted to know more about what GIS is and how people use it around the world. This article was a very good background to the idea of what GIS is and what it can be used for around the world. It was interesting to see the benefits and consequences of GIS especially when it comes to different generational approaches for technology and learning. I didn’t know that GIS has been around since 1960, which seems like it was very before other high end technology. Figure 1, was similar to me because in the fall semester I took soil morphology where we saw a map where we wore specific glasses to have a 3D vision. The maps from Soil Morphology were layered but you could only see the various layers with the specific glasses on which was really cool to see. The layers of figure 1, seemed very similar to the idea of this map in that class. I could visually see all the layers in a different form but still could understand the layout of the picture and what it represented. From this article it seems like GIS is just a big bundle and online version of data points and information from around the world. I found it interesting that you can combine different variables to get the data that you are trying to examine. Like with figure 1.4, seeing the correlation between pumps and cholera cases. I enjoyed reading about this introduction to GIS and I am excited to gain more information and understanding of GIS. I do have questions after reading this: How often is GIS information updated, for instance the layout of the ground, buildings and more? I also would like to know what tools can be used to create this data and if there are faster tools that are being created?
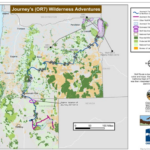
One source that I found was wolf tracking and the role of surveillance in the recovery of an endangered species, from ArcGIS. This was really interesting to read about and see the maps for tracking. The article specifically focused on Gray Wolves and their recovery and survival throughout the years after being put on the endangered species list. This article focused on Washington area and attached is the map that they collected from the tracking:
From another article it stated that in Washington State, “ Washington is home to about 33 packs. Nineteen of these packs have successfully bred. The Department of Fish and Wildlife has enforced laws to manage conflict with people over livestock predation by wolves. Because of these efforts, there are about 200 wolves in Washington.” https://worldpopulationreview.com/state-rankings/wolf-population-by-state
Another application that I found interesting was using GIS to study rivers. I think it’s really interesting to see where rivers were and where they are now and what changed their path. This was a short article that illustrated the basics of the study. https://serc.carleton.edu/eyesinthesky2/week6/study_rivers_gis.html
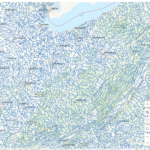
From this initial search I went deeper into finding maps of rivers in Ohio. From ArcGIS I was able to see rivers, canals and more in Ohio which was really interesting. Attached below is a snippet of the map that I looked at: