
My Name is Carl Mazabras and I am a Geography Major with a Business Minor. I am from New Canaan Connecticut which is 45 minutes outside of NYC. I am on the lacrosse team here at OWU and along with playing lacrosse some of the things I like to do are fish, work, play video games and spend time with my buddies. I have been interested in GIS ever since I took my first class with Dr. Rowley and have even completed a couple of GIS projects throughout my years here at OWU.
Throughout the reading I was able to see a lot of similarities in the breakdown of GIS with how the software works on the computers. The one area that stood out to me was the different layers we are going to have while creating the maps. The three visible layers in the first chapter are land use, land parcels and streets which is very similar to ARC GIS. Last year in the 112 class with Dr. Krygier we did a state population map with many different layers. Those layers consisted of roads, county boarders and state outline. Each of those layers were shown in the hot bar on the left first of the GIS software which could all be turned off or on it just depended on what we wanted to portray. To me this chapter is a great start because it really explains how the software will work without really telling you this is how the software works. I feel that people without any knowledge of ARC GIS will see the relationship from the book when they start to work in ARC because the entire software is based around layers that can be turned off and on to show different maps without changing the area being mapped. Layers can be showing different data or you can even put the layers into a timeline and show the history of an area. In 112 we had 12 layers each layer was in intervals of 10 years and the data linked to each year was the population for that county. We were able to show the population change and growth in the last 120 years working on one map with a ton of different layers.
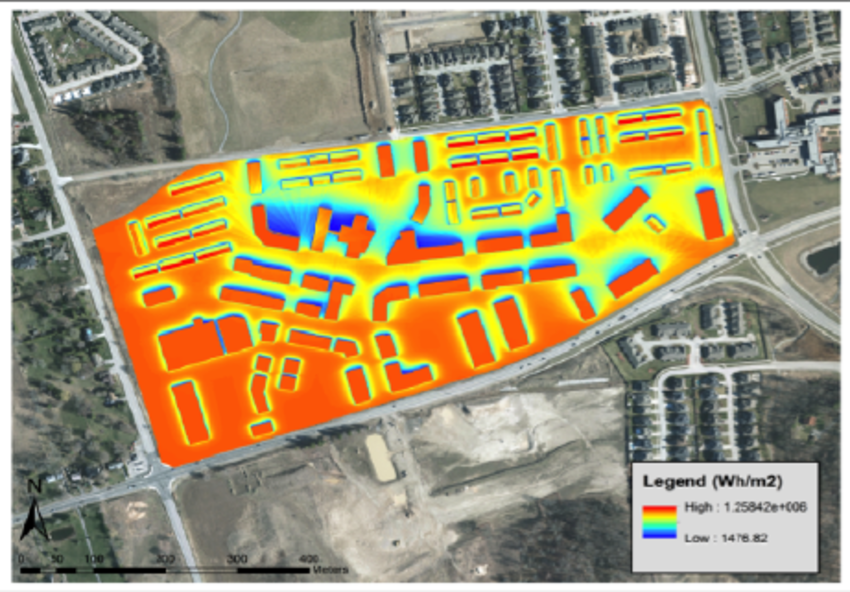
You can use GIS to map out areas for potential solar farms and I have a huge interest in renewable energies so this would be right up my ally. You can use drones to get perfect pictures of the buildings or areas that you want to put solar down. Below I have a map of solar insolation which is showing the wattage of energy that is hitting in the colored area red being high and blue being low. Another way you can use GIS is to map an area for construction to see what the land is made of by doing soil composition testing which has been done a larger scales but not yet done at a small scale like a singular property or block.
Nice fish. Thanks!