Chapter 1:
- GIS is composed of 5 parts: hardware, software, data, procedures, and people
- Can be used to map relationships, patterns, and trends in addition to simple cartography
- Interesting how GIS has been around since the 60’s. I wonder how difficult it was to use it back then
- Point, line, polygon data = vector data
- Features of same type = layers
- Raster= digital surface
- Attributes= in depth data
- Don’t be like me and do the exercises in the classic map view, and then get confused as to why everything looks different


Chapter 2:
Exercise 2A
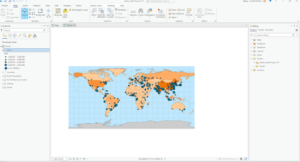
- PM concentrations are highest in Africa
- To restore contents, go the ‘View’ and select contents
- Geoprocessing toolbox is right next to contents
- Shanghai has the largest population
Exercise 2B
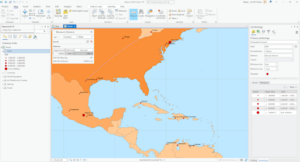
- Symbology= the way GIS features are displayed on a map
- The distance between San Antonio and Toronto is 1,440.32 mi

Exercise 2C
- The highest building is 339.8 ft
- Extrusion= stretching flat 2D features vertically to appear 3D
- This was cool- I felt like I was playing the Sims lol

Chapter 3
Exercise 3A
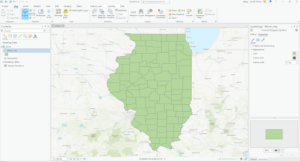
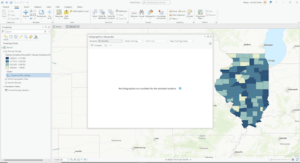
- The field name that indicates the state within the which the county features are located is called STATE_NAME
- 10575 residents of Wayne county are between 22-29 yrs
- Definition query: limit visible counties to only in Illinois, but source data will not change
- Clip: Select data based on layer of boundary (However, Illinois boundary not defined)
- Select and export: select counties in Illinois and export to new dataset
Exercise 3B
- Columns= fields
- There are six years of data represented
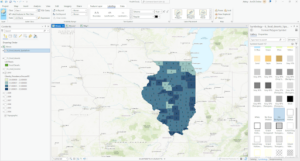
- Graduated colors= features are assigned a color that represents a quantity
- Classification methods:
- Manual interval classification
- Modify classification breaks manually with manual intervals
- Equal interval classification
- Range of data is equally divided by the number of classes chosen
- Defined Interval Classification
- Similar to equal interval, but define interval size to determine class number
- Quantile classification
- All classes have same number of features
- Natural breaks classification
- Based on natural groupings inherent in the data
- Geometric interval classification
- Creates class breaks that are based on class intervals with a geometric series
- Standard deviation classification
- Creates classes according to a number of standard deviation classifications
- Manual interval classification
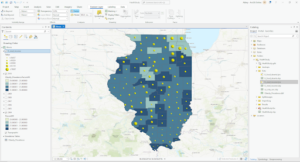
- I did not see a clear correlation between income and 2010 obesity rates
Exercise 3C
- I was not able to retrieve the infographics even though I was signed in to ArcGIS online 🙁
Exercise 3 dimension
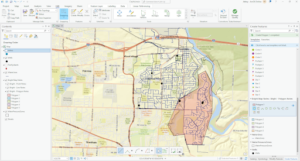
- There are 4 food deserts in Knox county
- Spatial join= define spatial relationship between 2 layers and combine attributes into an output layer
Chapter 4
Exercise 4A
- Coordinate systems
- Geographic coordinate system- uses latitude and longitude to define locations of points
- Projected coordinate system- uses map projections to transform longitude and latitude coordinates into planar coordinates
- On the fly projection
- Projected coordinates on first layer applied to subsequent layers
- Metadata
- Textual info about dataset
Exercise 4B
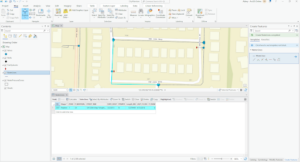
- Snapping= magnet
- The selected line has 4 vertices
Exercise 4C
- The shape area value was halved
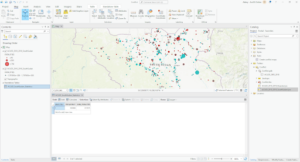
Chapter 5
Exercise 5A
- Conflict types:
- Riots/protests
- Battle
- Remote violence
- Strategic development
- Violence against civilians
- 727015 fatalities
Exercise 5b
- 41 riots/protests
- 71 fatalities
Exercise 5c
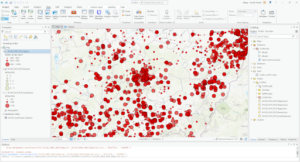
- Layer by attribute and Summary statistics are combined
- 26323 fatalities
very good documentation. when you run into bugs or stuff that won’t work it’s good to move on. i can try and help figure it out if you want, but also ok (since there is so much stuff) to have you just move on and not worry about it.