Becker Week 3

Chapter 3

  • ArcGIS Experience Builder allows you to combine functions from multiple apps and provides more functionality than any one ArcGIS instant app
  • Experience Builder includes premade widgets that provide functions such as mapping, table view, querying, charting, and reporting

Basics of Experience Builder

    • Allows you to create unique web experiences using flexible layouts, content, and widgets that interact with 2D and 3D data
    • Key features:
      • Creates HTML and JavaScript apps without programming
      • Creates 2D and 3D web apps that work well on desktops, tablets, and smartphones
      • Includes out-of-the-box widgets that can be flexibly remixed and configured
      • Flexible layouts to build apps that are mapcentric or non-mapcentric and can display them on a rolling screen or fixed pages
      • Make a widget respond to actions of another widget
      • Provides framework for creators to make their own widgets
    • Template – Theme – Data – Widgets – Layouts – Publish
  • Basic widgets- functional widgets that perform as app tools
  • Layout widgets- containers that help organize widgets on your page/window
    • Setting panel for a widget has:
      • Content- data sources, links, behavior, and other settings of widget
      • Style- defines the size, position, background, border, color, box shadow, animation, transition, and other settings
      • Actions- make widgets talk and work with one another
  • Message actions- listen to triggers and perform actions automatically
  • Data actions- provide button for users to click
  • Triggers- events generated by source widget
  • Targets- perform actions responding to the trigger
  • Actions- specific business logic that the targets perform
  • 3 Editions of Experience Builder: 
    • Embedded in ArcGIS Online
    • Embedded in Portal for ArcGIS
    • Developer edition

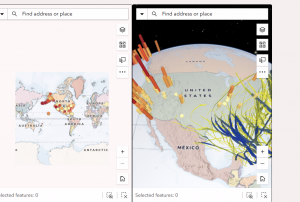
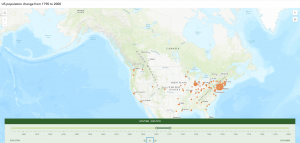
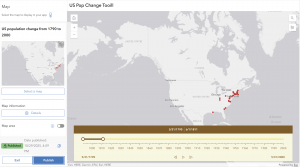
  • My idea for this chapter is to use the Web Experience setup to create a 2D and 3D mapping of droughts and food shortages in the Midwest. People could use these maps to get a visual representation of the relationship between the two.

Chapter 4

    • Mobile devices are becoming the main way to use Web GIS (Mobile GIS)
    • Concepts and Advantages
  • Mobility
  • Location awareness- can use GPS, cellular networks, Wi-Fi networks, etc. to pinpoint location of mobile device
  • Ease of data collection
  • Near-real-time information
  • Large volume of users
  • Versatile means of communication
    • Technologies for GIS
      • Mobile devices
      • Mobile operating systems
      • Wireless communication technology
      • Positioning technology
    • Mobile limits speed, memory size, battery power, etc.
    • Many organizations need to share data with the public and simultaneously allow members within the organization to keep that data up to date. Hosted feature layer views provide a direct way to do this
  • Data integrity- feature template for a layer that represents schools
    • feature template can have preset symbols and default values for one or multiple fields
  • Browser-based approach- access these apps through mobile web browsers
  • Native-based approach- apps downloaded or installed on mobile devices
  • Hybrid-based approach- combination of browser and native based approaches
  • Native apps/fields operations: ArcGIS Field Maps, ArcGIS Survey123, ArcGIS QuickCapture, ArcGIS Navigator, ArcGIS Companion, ArcGIS Earth, ArcGIS Mission Responder, and ArcGIS Indoors mobile viewer
  • ArcGIS has offline mode to still be functional when disconnected from internet
  • ArcGIS Field Maps Capabilities:
    • Collect and update data using the map or GPS.
    • Download maps to your device and work offline.
    • Collect points, lines, areas, and view related tables.
    • Design easy-to-use smart forms.
    • Attach photos to your features.
    • Use professional-grade GPS receivers.
    • Search for places and features.
    • Support high-accuracy 3D data collection capabilities.
  • Allows organizations to track where mobile workers have been and where they currently are (Invasive???)
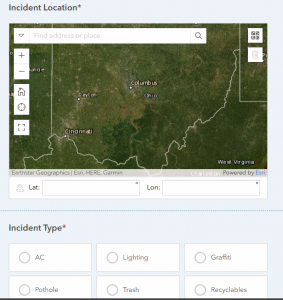
  • ArcGIS Survey123 Capabilities:
    • Design smart surveys with predefined questions that support domains (which appear as the choices in drop-down lists) and feature templates, default values, embedded audio and images, and simple (for example, if the answer to one question is yes, show a related question; otherwise, do not show the related question) and sophisticated rules.
    • Capture field data using an intuitive, formcentric data-gathering solution.
    • Store survey results in hosted feature layers that you can share with organization users.
    • Perform online and offline data collection.
  • Ways to design smart forms: Web Designer, ArcGIS Survey123 Connect
  • ArcGIS QuickCapture can allow for data collection in quick situations like a car driving by
  • ArcGIS AppStudio provides place to build apps across platforms

An idea I have using the ideas from this chapter is to create an app that allows users to input good hiking places near our campus. With this app, it would be easy for Ohio Wesleyan students to find fun places to go enjoy the outdoors.

Massaro Week 3

Chapter 3: This chapter taught me how to create a web experience with both 3D and 2D data. It was super cool to see how the different maps were able to show the data in different ways. This chapter also went over the process of adding widgets to the maps. The widgets are very useful because they make the data interactive and narrow the data down to show patterns to the viewers. The widgets also helped in organizing the map so that it was easier to navigate and understand. Something else that was mentioned in this chapter was the use of GIS software on different devices, like mobile devices. This is super useful because it makes the software easy to access and edit. In turn, this also makes the software more accurate because users can update it as needed. 

If I were to create a map using my own data for this, I would do something along the lines of tracking the population growth in cities in Ohio over the years.

Chapter 4:This chapter taught me how to create a survey and analyze the results of the survey. I did run into a few issues with the viewing of certain questions. One of the questions was only supposed to be viewed if a certain answer was selected on a previous question. However, I think the program from the book and the current program are different because I was not able to edit it in the way the book was describing. The pictures from the book also didn’t align with what I was seeing on my computer. I was able to use information from the survey to create a map with certain lines and points representing the specific incidents within an area.

A way that these aspects could be applied would be to report utility work that needs to be done on campus. For example, broken showers and toilets. Another example of an application of this would be tracking animal sightings in a nature reserve. People could submit a survey of where they saw the animals. The sightings could be turned into points, and a line could be drawn between close sightings of the same animal to infer its daily activity and travel.

Tadokoro – Week 5

Chapter 7

In this tutorial, I learned how to create web scenes and 3D web apps using ArcGIS, transforming maps into more immersive and interactive experiences. It was fascinating to see flat 2D maps evolve into 3D maps that tell a visual story. In Section 7.1, I started by exploring the Scene Viewer through the StoryMaps app, checking out various types of scene layers. Next, in Section 7.2, I created a thematic web scene to visualize the population and population density of the United States in 3D. By applying extrusion based on each state’s population, the flat map turned into a three-dimensional landscape that clearly showed differences in population density, from sparsely populated areas to high-density regions like Washington, D.C.

In Section 7.3, I tried designing a 3D park scene using realistic 3D symbols like trees, benches, flowers, cars, and boats. However, nothing appeared on the map, and I soon realized that the original park data was missing… In Section 7.4, I used elevation data to visualize features not only on the ground but also underground and in the air, including tunnels and helicopters. There was even one enormous helicopter that really stood out. Finally, in Section 7.5, I learned that even small edits to 2D data can dramatically enhance the expressiveness of a 3D scene.

Tadokoro – Week4

Chapter 5

In this tutorial, I used ArcGIS Pro to work with data showing major earthquakes and hurricanes in the United States between 2000 and 2008. Using this dataset, I created and shared both vector tile layers and raster tile layers, then compared their differences through a web app. I published both types of layers to ArcGIS Online  and explored how they differ in visual quality, file size, and zoom levels. This helped me better understand the styling flexibility and performance of vector tiles compared to raster tiles.

At the end, when I reached the “Which is which?” question, I concluded that the right side was the raster layer,  because each point appeared to have fixed pixel-based values rather than dynamic features. Overall, this chapter went very smoothly for me!!


Chapter 6

This tutorial was all about bringing real-time GIS data to life. I created a dashboard web app for the city of Redlands, California, designed to help coordinate emergency response efforts. The dashboard included several dynamic layers showing the near-real-time locations of police, fire, and ambulance vehicles, along with 911 call incidents across the city. Each layer refreshed automatically every few seconds, so the map was constantly updating ,  it felt like watching a live control center!  In the dashboard, I also added lists and tables to display the latest incident details, charts to summarize categories and counts, and even a filter tool to narrow down incidents by their status. Using Arcade expressions, I customized the list to highlight cardiac emergencies in red, making it easier for dispatchers to spot critical cases right away.

After that, in Exercise 2, I switched gears to a more historical theme, building a web app to show population changes in major U.S. cities over the past 200 years. Using a CSV dataset, I visualized how cities grew and evolved over time through animated maps, showing both the spatial and temporal trends in population growth.

It was fascinating to see how GIS can handle both real-time monitoring and long-term temporal analysis,  two very different but equally powerful applications.

Datta – Week 3

CHAPTER 3: ArcGIS Experience Builder

  • Allows you to customize your GIS experience
  • Mobile Focussed, 2D and 3D
  • Creates HTML and Java apps without programming
  • Templates, Widgets, and themes all available to make it even easier
  • Easy to share and upload onto the web
  • Widgets are the same sort of website widgets you’d expect
  • Unique to ArcGIS’ experience builder is the ability to port ArcGIS Online or portals to ArcGIS online within the website innately
  • You can also code your own widgets if you know HTML

CHAPTER 4: MOBILE GIS

  • Mobile GIS has the added benefit of portability location awareness, as well as real time information and data collection ease
  • Mobile tends to have less bandwidth and RAM space so more complicated GIS projects can’t be ported
  • You can make feature layers viewable and editable by multiple different people, which allows data integrity while also keeping the feature available for editing
  • Can be made in browsers or in native applications or both at once
  • ArcGIS Fieldmaps combines various different ArcGIS products and allows for a team to use GIS for field work of any kind
  • Fieldmaps can collect user data, can allow people to download maps for offline use, etc
  • Can track mobile users in real time
  • ArcGIS Survey123 is a survey product, presumably connected to location for GIS usage
  • ArcGIS Indoors mobile allows you to map the inside of buildings like any other GIS map
  • ArcGIS Companion is a generic app for ArcGIS
  • LBS – service on mobile which considers the device’s geographic location
  • VGI is spatial data collected by citizens as opposed to professionals
  • VR is a simulated 3D map in space


APPLICATION:

  • Using the Experience Builder and Mobile GIS could make something similar to websites/apps like Inaturalist or Merlin Bird ID where users submit data which can be mapped spatially by scientists. I think both would be necessary for this.

Walz – Week 3

Aiden Walz – Week 3

Chapter 3:

Chapter 3 went over the ArcGIS experience builder and how it’s a hodgepodge of multiple features and apps together that the user can customize to include more functionality than any individual ArcGIS instant app.

  • Able to create 2D and 3D web apps for multiple devices
  • Includes multiple widgets for different functions and allows for customization
  • Has flexible layouts to build maps that are map/non-map centered and can be viewed as multiple or single pages
  • Can select a premade template  or start from scratch
  • Allows ability to select a theme and add source data 
  • Basic widgets include things like map, legend, layers and more
  • Layout widgets include things like section, column, row and more
  • Widget settings include; content, style, action
  • Content defines the data sources
  • Style defines the how it appears basically
  • Action defines how widgets interact with one another
  • Experience builder has three editions: One in ArcGIS Online, one in portal for ArcGIS, one  in developer edition
  • Portal and developer allow for customization of widgets, online doesn’t 
  • Tutorial 3 went over developing a public web experience to view data about historical earthquakes and hurricanes
  • Web app was able to display the earthquake data as a 2D and 3D map using map widgets
  • I personally think the 2D map looked better visually than the 3D
  • I added a text widget to the Data summary view to show some basic information about the earthquakes and hurricanes layer
  • Then I used a table widget to display attributes of the earthquakes
  • Overall a I used a lot of different widgets to visualize or showcase information about the data source


Chapter 4:

Chapter 4 went over the mobile GIS part of ArcGIS online as mobile devices are one of the most common tools people have to view data

  • Choosing mobile app strategy depends on your approach: Browser vs native vs hybrid
  • Browser approaches looks at user using apps thru mobile web browsers
  • Native requires some of type of IOS to develop the app, and hybrid is a both browser and native 
  • Mobile GIS related to many other types of apps and frontiers: LBS, VGI, VR, AR
  • LBS (Location based service): Provide info based on user location
  • VGI (Volunteered Geographic Information): Things like Waze
  • VR (Virtual reality), & AR (Augmented reality)
  • ArcGIS Mobile Apps: Collector: Field data collection using GPS/maps, Survey123: Form-based surveys, Workforce: Assigns and tracks field tasks, Explorer & Navigator: Map viewing and navigation, AppStudio: Builds cross-platform native apps without coding
  • Tutorial 4 went over these topics and items: Designing a smart form on Survery123 and collecting Survery123 mobile app. Then using ArcGIS Quick Capture I made an editable layer  and configured a web map to view things like street cracks (wasn’t entirely sure at what the data was). And then lastly I prepared data to use for AuGeo, basically ArcGIS in AR, it was a bit weird using the camera to view things but I could easily see why this would be useful for visualizing things


For an application idea for chapter 4 I could make a mobile app about local tree health in a certain area.  I could use Survey123 and have users record location, species and condition of trees in a certain area directly from their mobile devices. The app would allow them to attaches photos and note any signs of damage or possibly disease if I want the app to focus on that approach, and then submit them in real time. This app could help city staff and groups track the health of a tree population and visualize patterns on a web map.


I think the app I will make for my final from chapter 1-4 will be a ArcGIS story map over local art museums in Columbus, Ohio. Would allow tourists or residents to look at where these art museums are, along with have a photo of what they look like and a description of what these museums hold.

Thompson – week 3

Chapter 3 – In this chapter I learned a lot about just basic ideas of the database such as map layers, different mechanisms, and even creating an app using web services. This also helps create a map that can change over time. This chapter allows me to explore different spatial data. 

There are a lot of different things you could do with the stuff learned in chapter 3, such as creating a map with changing features over time and using those different mechanisms to add the data you may need for your map. 


Chapter 4 – This chapter goes over more “advanced” types of things such as comparing different layers and points. It allows me to learn how to perform/create high-quality and fast working basemaps that can go into configuring a web app. This application is important when it comes to the performance of things like comparison widgets. This can be used for things like looking at two different maps for things and comparing them to see which data is best for what I’m trying to accomplish. 


Fox – Week 3

Chapter 3: This chapter really shows how easy WebGIS is compared to the desktop version (in my opinion). WebGIS allows us to create our own web experiences using flexible layouts, content, and widgets that interact with both 2D and 3D data. We can start with templates for mobile-adaptive apps, modify template layouts for a custom design on different screen sizes, or even build apps from scratch. The ability to do those things adds to the availability of this application and how easily one can understand it. When using these applications, you follow a little pattern on how to complete the maps. It goes: pick a template or start from scratch, pick a theme, add your data, add and move around your widgets, refine your layout, and finally save and share your maps! A widget is a JavaScript and HTML component that encapsulates a set of focused functions. Experience Builder provides two types of widgets: basic and layout. Basic widgets can perform as app tools. Basic widgets include map, legend, layers, query, filter, edit, chart, elevation profile, survey, and more. Layout widgets help organize widgets on your pages or windows. Layout widgets include section, column, row, fixed panel, sidebar, and more. One important thing about widgets is that you need to pay attention to your version of ARCGIS because the ArcGIS Online edition doesn’t allow custom widgets; the Portal for ArcGIS edition allows the deployment and use of custom widgets; the developer edition allows the creation, deployment, and use of custom widgets. Overall, just be aware of your GIS and the different things you can do with it

Chapter 4: This chapter talks about mobile GIS and how beneficial that is. I think that offering a mobile version is amazing as it increases the availability of ArcGIS, giving more people the opportunity to learn it. However, there are a few disadvantages to mobile GIS; the small size of mobile devices imposes limitations on speed, memory size, battery power, bandwidth and network connections, screen size, and keyboard size. As an “owner” of a hosted feature layer, you’re also able to be an editor tracker. Editor tracking is the ability to track who has changed the data of a feature layer and when the change was made. Editor tracking can help create more accountability and quality control over the edited data. This is, if you choose to enable it on your layers. A feature layer can contain a feature template, which you can define in ArcGIS Desktop or Map Viewer in ArcGIS Online. A feature template defines the types of data items that users can add to a layer. A template ensures data integrity and makes editing easier for your users. There are also 3 different approaches that can be taken with mobile GIS: browser-based, native-based, and hybrid-based. ArcGIS provides a suite of apps for field operations as well, including ArcGIS Field Maps, ArcGIS Survey123, ArcGIS QuickCapture, ArcGIS Navigator, ArcGIS Companion, ArcGIS Earth, ArcGIS Mission Responder, and ArcGIS Indoors mobile viewer. 

One application of what was talked about in these 2 chapters would be the ability to create a map of tornado locations in Ohio over the past 5 years to see if there is a recurring pattern within those locations.

Tooill – Week 4

Chapter 5-

This chapter was pretty short and focused on creating vector and raster tile layers. Vector tile layers store geographic data as points as points, lines, and polygons. They represent the geometry and attributes of features and are more flexible and efficient. They are best used for interactive maps. Raster tile layers are image tiles. They show small portions of a map. They are used for mapping consistent geography that isn’t expected to change very quickly, such as static basemaps.

  • The tutorial walked me through how to add and publish a portal, but my portal was already set up, so I did not have to do that.
  • I downloaded the data for this chapter onto my computer and then added a vector layer to a new project that I created from the data I downloaded.
  • To be honest, I’m not really sure how I added the vector layer. I went through all of the directions and did as the tutorial said, but there was never a specific step that said I was adding a vector layer. Then, all of a sudden, I was configuring vector tiles and analyzing and publishing my vector layer.
  • Next, I created a raster layer. The steps to creating a raster layer were very similar, and again I’m not really sure where the actual raster layer was created. I think it was maybe just already created from the data I downloaded for the chapter and all I had to do was add it.
  • After I created both the vector and raster layers, I compared them by using a slider/swipe on story maps.
  • A practical application for this chapter would be evaluating wildfire risk. Raster layers would include consistent information, such as vegetation and elevation, while vector layers would include data on things like buildings and boundaries.

Chapter 6-

In this chapter, I created a dashboard web app for the city of Redlands, California, to coordinate response efforts for the city’s medical, police, and fire departments.  This web map displays the most recent incident details, monitors real-time locations (with minimal lag is the idea), and allows users to filter incidents by the type that they are.

  • To start this tutorial, I searched for Redlands Dashboard Map owner:gtkwebgis5 and opened the web map in map viewer. Then, I added a temporal layer of sample data.
  • This temporal layer added live cameras by the California Department of Transportation that shows near-real-time highway photos in the pop-ups.
  • I shared this web map with everyone and then I created a dashboard web app with the map that I had just created in the previous steps.
  • I added lots of elements to the map, including a gauge, chart, table, list, and map.
  • The gauge is responsible for displaying how many open incidents there are, with green representing not many open incidents, yellow representing many open incidents, and red showing too many open incidents.
  • The list element lists the open incidents as they occur.
  • The chart is responsible for representing the ratio of open to closed incidents.
  • The table includes information about incidents, such as the location and contact information.
  • Finally, the map just shows geographic data on where the incidents are occurring.
  • The tutorial then tried to have me configure actions and targets, but I struggled with getting these to work because not all of the expressions were working like they were supposed to even though I was copying and pasting them directly into the expression box to make sure that I didn’t type them in wrong.
  • A practical application from this chapter would include creating a dashboard web app that monitors environmental features such as air and water quality or weather.