Chapter 5
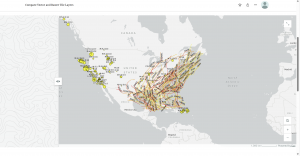
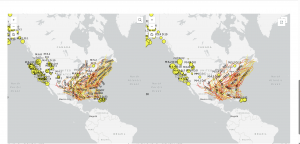
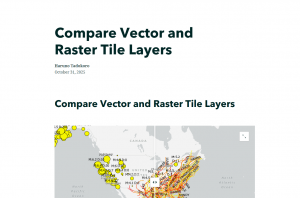
In this tutorial, I used ArcGIS Pro to work with data showing major earthquakes and hurricanes in the United States between 2000 and 2008. Using this dataset, I created and shared both vector tile layers and raster tile layers, then compared their differences through a web app. I published both types of layers to ArcGIS Online and explored how they differ in visual quality, file size, and zoom levels. This helped me better understand the styling flexibility and performance of vector tiles compared to raster tiles.
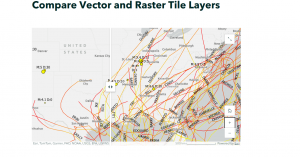
At the end, when I reached the “Which is which?” question, I concluded that the right side was the raster layer, because each point appeared to have fixed pixel-based values rather than dynamic features. Overall, this chapter went very smoothly for me!!
Chapter 6
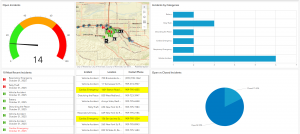
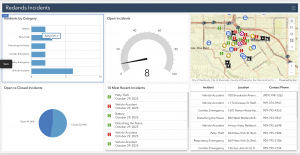
This tutorial was all about bringing real-time GIS data to life. I created a dashboard web app for the city of Redlands, California, designed to help coordinate emergency response efforts. The dashboard included several dynamic layers showing the near-real-time locations of police, fire, and ambulance vehicles, along with 911 call incidents across the city. Each layer refreshed automatically every few seconds, so the map was constantly updating , it felt like watching a live control center! In the dashboard, I also added lists and tables to display the latest incident details, charts to summarize categories and counts, and even a filter tool to narrow down incidents by their status. Using Arcade expressions, I customized the list to highlight cardiac emergencies in red, making it easier for dispatchers to spot critical cases right away.
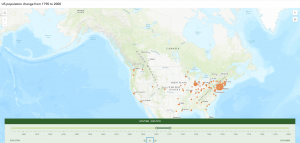
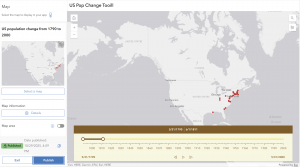
After that, in Exercise 2, I switched gears to a more historical theme, building a web app to show population changes in major U.S. cities over the past 200 years. Using a CSV dataset, I visualized how cities grew and evolved over time through animated maps, showing both the spatial and temporal trends in population growth.
It was fascinating to see how GIS can handle both real-time monitoring and long-term temporal analysis, two very different but equally powerful applications.