Chapter 7:
3D web maps are called web scenes or 3D scenes. Photo-realistic scenes try to make objects look as accurate as possible. Cartographic are often used for display information like population density and zoning laws.
Surfaces: continuous measurement, typically elevation, often referred to as digital elevation model (DEM), digital terrain model (DTM)- bare ground, or digital surface model (DSM)- ground surface and objects on it.
Features: On, above, or below surfaces. May be 2D or 3D. Operational layers of the 3D map.
Textures: covers of 3D features
Atmospheric effects: lighting, fog, etc
3D object scene layers: represent and visualize 3D objects
Building scene layers: shows complex digital models of buildings that you can interact with – materials, properties, locations.
Point scene layers: cached point scene layers are thinned so that certain details are only visible at certain zoom levels to display large amounts of point data that wold take too long as a point feature layer
Voxel scene layers: multidimensional spatial and temporal data in 3D volumetric visualization
I struggled for a minute to find where Elevation mode and Absolute Height could be configured in the Style pane because they are now under Layer Properties rather than Layer Style. Once I figured out where those were, figuring out where everything else is was pretty intuitive.
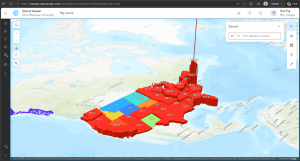
My computer is really struggling with the 3D scenes, especially the last one since someone has put a giant helicopter in the publicly edited scene.
Application:
A potential application of chapter 7 is to create a tour of where I grew up, since I’d like to show my friends, but it’s too far away for me to bring them there in person. I would use the OpenStreetMap Style 3D Basemap and add paths and way-points that show pictures that I have of some of my favorite places.