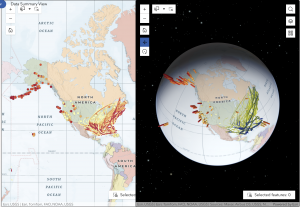
CHAPTER 3: ArcGIS Experience Builder
- Allows you to customize your GIS experience
- Mobile Focussed, 2D and 3D
- Creates HTML and Java apps without programming
- Templates, Widgets, and themes all available to make it even easier
- Easy to share and upload onto the web
- Widgets are the same sort of website widgets you’d expect
- Unique to ArcGIS’ experience builder is the ability to port ArcGIS Online or portals to ArcGIS online within the website innately
- You can also code your own widgets if you know HTML
CHAPTER 4: MOBILE GIS
- Mobile GIS has the added benefit of portability location awareness, as well as real time information and data collection ease
- Mobile tends to have less bandwidth and RAM space so more complicated GIS projects can’t be ported
- You can make feature layers viewable and editable by multiple different people, which allows data integrity while also keeping the feature available for editing
- Can be made in browsers or in native applications or both at once
- ArcGIS Fieldmaps combines various different ArcGIS products and allows for a team to use GIS for field work of any kind
- Fieldmaps can collect user data, can allow people to download maps for offline use, etc
- Can track mobile users in real time
- ArcGIS Survey123 is a survey product, presumably connected to location for GIS usage
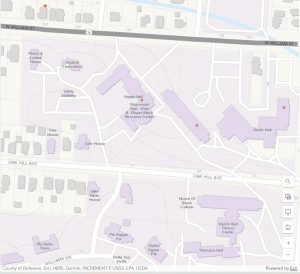
- ArcGIS Indoors mobile allows you to map the inside of buildings like any other GIS map
- ArcGIS Companion is a generic app for ArcGIS
- LBS – service on mobile which considers the device’s geographic location
- VGI is spatial data collected by citizens as opposed to professionals
- VR is a simulated 3D map in space
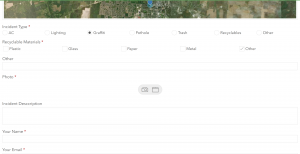
APPLICATION:
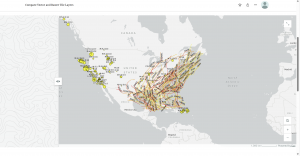
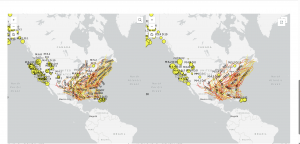
- Using the Experience Builder and Mobile GIS could make something similar to websites/apps like Inaturalist or Merlin Bird ID where users submit data which can be mapped spatially by scientists. I think both would be necessary for this.