chlebowski final

first web app is a story map of a compilation of ornithological research papers that talk about various topics like migration, sexual selection, social behavior, etc.

https://arcg.is/rXDb4

second web app is a slider of U.S. co2 emissions from transportation from 1970-2020

https://owugis.maps.arcgis.com/apps/instant/slider/index.html?appid=4de788ec6fac45faaa2033c9dbbce69a

i tried my hardest to get labels for each point on the map to show the numeric amount but they were being super strange and either doubling for some years or freezing on certain years so i just scrapped it

chlebowski week 6

Week 6

notes para chapter 7:

  • Page 248 number 7 chose the layer USA States Generalized Boundaries
  • Page 248 number 11 chose population density instead of pop. per sq. mi. since that was not an available field
  • Same for the text as well

https://owugis.maps.arcgis.com/home/webscene/viewer.html?webscene=29ad4c671bc64dc599a71ade1b9994e6

  • Designing the 3d objects and watching them sprout up from 2d ones was very satisfying
  • I was blown away at the extensive 3d shapefiles that i was able to choose from, really allows for decent amounts of freedom and customization

https://owugis.maps.arcgis.com/home/webscene/viewer.html?webscene=0d46cf98aa2e4424ab1f58e5728916e4

Silly helicopter version

https://owugis.maps.arcgis.com/home/webscene/viewer.html?webscene=8871e440bc054329aff17731fc5ca08a

  • Added more silly large helicopters and cars that definitely do not have impervious surfaces left in the park to park at haha
  • Page 263 number 6 the analyze toolbar is the scene tool button
  • The slice tool option is very interesting, wonder what uses it could have besides like for aesthetic purposes of things clipping through other objects

it seems they havent cleaned up the public layer in a while


a biological application that could be used by 3d renditions of 2d map layers, especially by adding 3d objects into the layer is through making a visual map explanation of an experimental methods approach. this immediately reminds me of the chimney swift project that was proposed in 2018, a chimney shape file could have been used to put the idealized locations of said chimneys to give a very detailed explanation of where exactly they were to be constructed. this of course could be done with endless other project ideas, one that came to mind being placing 3d net shapes at locations where there would be the best chances to mist net and potentially band a song bird species of interest.

chlebowski week 5

notes para chapter 6:

  • Looking at the highway cams and reading the various incident reports is pretty fun

  • Struggled a bit with 6.4, doing anything in the expressions area was a bit difficult to follow
  • Couldnt find the list tab on page 215 number 2 so i just skipped it, it seemed to not affect anything major, still was able to do the following steps


https://owugis.maps.arcgis.com/apps/dashboards/4742e5f075534fb080fea8d78b3ec1f8

https://owugis.maps.arcgis.com/apps/instant/slider/index.html?appid=4971fb47adbf4f3383ecf69c098d16db


a cool application that i did a bit in geog 112 was by choosing a state and looking at different counties and plotting the population change in the specific counties over time, using the instant apps to make the animation process a lot easier than it was by just taking a bunch of pictures and cycling them to show population change by color

a cool zoology application could be done at the state level like mentioned above but with conservation of counted species, for example using ebird data of sighted specific species in the counties around central ohio over the past 20 years to monitor which species population levels are staying the same, increasing, or falling

chlebowski week 4

Week 3

Notes para chapter 3:

  • 3.1 number 25 you do not click enter on your keyboard, instead click the url button again after inputting the correct url and then click x on the panel
  • 3.3 number 5 filter is named framework
  • 3.4 number 7 make sure to click customize to find the clear selection button
  • 3.5 number 21 there is no “year” value in the sort by tab, only category and value

https://experience.arcgis.com/experience/8b1fa5ec705b4d4cbf49ec6851c674ab/


Week 4

notes:

  • 4.1 number 8 there is no option for “imagery hybrid”, i chose imagery with labels instead
  • 4.1 number 9 single choice is called single option
  • Same with multiple choice and multiple select
  • 4.1 number 14 no set rule window, thus skipped
  • 4.3 number 4 keep selected define your own layer
  • 4.4 number 13 conditional variability is the settings button next the the required checkbox

a cool application could be to use the AuGeo to make a mini-tour guide aid using the first person pov function on the app using your camera. this could be done by inputting points on a map layer with a detailed description of the site, with a picture for people to eventually walk to and see in person. it would be pretty simple to make too, especially since location data and information can be manually inputted and clicked on the map layer without any additional inputs.

for the final project, i am definitely going to use a story map to explain a study or specific study organism and the various components of their life, most likely going to be a bird species due to the cool mapping ideas that can be done via migration data across a large area

chlebowski week 3

notes:

  • C1
    • in 1.3 number 4 is that I do not see a basemap that is labeled “Community Map” which is strange as I remember using that same basemap for some story maps that I have recently made. I decided to use the “Streets” basemap instead as it looked like the closest one to community map.
    • The configure pop-ups button is just called pop-ups in the settings toolbar
    • It was pretty cool making a web map that can previewed with mobile phone dimensions, especially considering how useful it could be as so much information in the past 5 or so years has been consumed simply on our phones

  • C2
    • Page 41 shows all of the smart-mapping styles; I love these so much i cant put my finger on why but they are just so interesting to read and especially to play around with them when deciding which one to use to represent data and even what type of data suits each style the best
    • 2.1 number 6 there is no state location type, only a region location type that uses the state field instead
    • I am not a fan of the color theory of red being gains, as i often see in media that red can also effectively be used as losses and blue for gains as well, instead i like a color like green for gains
      • As protest i changed my gain arrows to pink !!!
    • 2.3 number 5 globals is not a button, it is called profile variables
    • Despite backtracking the settings and rechecking the csv sheet, the bargraph in the city pop-up menu does not want to show, even when i selected it in the configure chart, it shows the space where it should be but it does not show any information
    • 2.5 number 21 there is no place map button, just click save
    • 2.5 number 24 there is no map action option in the block palette, there is adding a map and media action but no map action
      • Oh okay it wants us to use the media action button!!!

My story map!!!!: https://arcg.is/1ubG1n

An application that could be created from these two chapters would be a story map based on a compilation of birding trips and what you saw, heard, and felt during the trips! Maps could be inserted into the story map using spreadsheet data of bird sightings over an extended period of time with location data on where you went birding, where you spotted specific birds, pictures of the birds (or even if you got your own in the field), a description and overview of the specific birds that you saw (linking to other informational websites), and possibly a comparison to the amount of birds that are commonly and uncommonly found in the areas versus what you saw!

Point data on where specifically you saw each bird based on external devices like ebird.org or by simply placing points on a map and running a story map through each of the points, explaining the amount and different types of avians seen at each location, and maybe a link to recent research about the birds hast were seen or just links to website explaining their range or behaviors in greater detail.


Chlebowski Week 1

Howdy, my name is Chewy and I am a senior zoology major! I took 291 a year ago so I wanted to eventually take the online portion of the course as well to round out the experience. Hoping to learn some cool things here since I have already played around in arconline before, especially in some super rudimentary story maps that I have made and other random basemaps for other classes.

My Profile (2 comments)

  • By clicking on the profile tab, it brings up many links that lead to an ArcGIS blog where updates about the software and the future are made and shared among the community, a community tab to answer commonly asked questions, and a training tab for helpful courses.
  • Additionally, the help tab at the bottom features video tutorials, helpful web pages of how to use new tools like the Calculate Composite Index Tool and ArcGIS Data Pipelines as well as helpful tricks and tips.

Get Started: What is ArcGIS Online (2 comments)

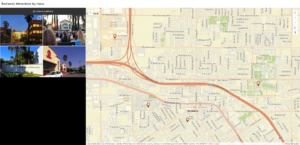
  • On the sidebar, in the maps section under measurements, it gives detailed instructions on how to measure distance and area in map viewer: using the measurement toolbar, click either the measure distance or measure area option. After this, click once to start the measurement and depending on what option is chosen, clicking once will measure to a vertex of the line or area, and double clicking will complete the measurement. 
  • In scene viewer, you can construct scenes that present geographic information in 3D environments like in street views, topographic maps, and navigation visuals. These can be altered and customized to change their weather, time of day, elevation profile, and many other settings to make the experience as full as you want it to be.

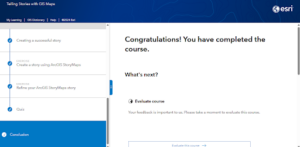
Since I already finished the ArcGIS Online Basics, I decided to complete the course titled “Telling Stories with GIS Maps”

Yellowstone Lake_chewy (arcgis.com)

2 applications:

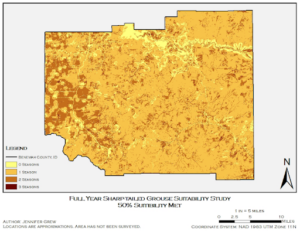
“Using Geographic Information Systems to Select Suitable Columbian Sharp-Tailed Grouse Habitat in Northern Idaho”: https://digitalcommons.du.edu/geog_ms_capstone/39/

Used GIS raster layers to find areas of best area viability for the grouse species in different seasons by using a system that ranks the land with all 5 variables being met being the most suitable for the specific time period.

“Utilization Probability Map for Migrating Bald Eagles in Northeastern North America: A Tool for Siting Wind Energy Facilities and Other Flight Hazards”: https://journals.plos.org/plosone/article?id=10.1371/journal.pone.0157807

Determined most common bald eagle routes in northeast US and how these coincide with both high wind speed locations as well as with wind turbines over 100 meters in size to gauge the relative danger of bald eagles and developing turbine initiatives in this area.