Chapter 5
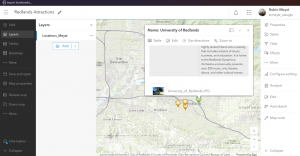
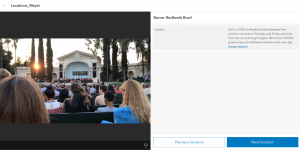
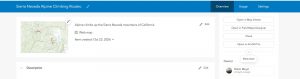
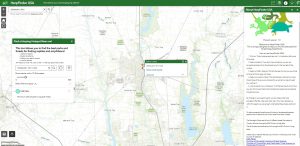
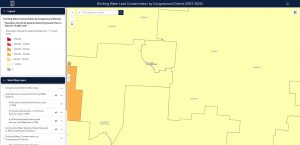
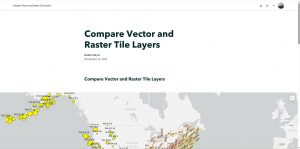
Chapter 5 was a fairly short tutorial, dealing mainly with uploading content from ArcGIS Pro to ArcGIS Online. With my experience from GEOG 291, I found it fairly easy to naviagte, as a previous section of the ArcGIS Pro textbook had us accomplish the very same task of uploading raster and vector layers. Even with the fact the data is deprecated, I did not have any issues with the data in ArcGIS Pro or ArcGIS Online, only giving me a brief warning when I tried to save the project, and briefly freezing as it loaded. The second half of the chapter reintroduces story maps, specifically to compare and contrast the differences between raster and vector layers. It is fairly easy to tell once zoomed into the map, as raster layers lose detail when you zoom in close enough, about the county or city level. Additionally, I was able to play around with the features of the StoryMap a little, and ended up adding a quiz at the end when prompted with which layer is which.
Chapter 6
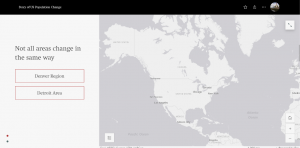
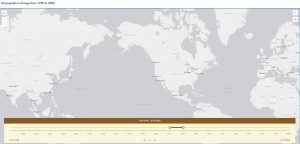
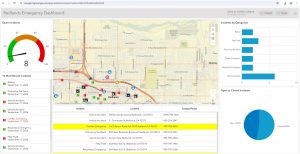
Chapter 6 was far more in depth, dealing mainly with creating dashboards and how to accurately display time in ArcGIS Online. With all of the factors that went into the dashboard, I found it fun to assemble, and interesting to learn of the criminal history of an area I do not live in. Additionally, the dashboard was an interesting look into what GIS can accomplish for police work and programs and wbesites for concerned families of a certain area, or people trying to view the crime rates of a potential new city to live in. I tried to attempt the coding section by hand, but after multiple attmepts, I copy-pasted the code from the folder, making the process much smoother. In my US population time map, I found two interesting presumed glitches of note: in one decade of the population playback, 1910-1920 showed zero data points. Additionally, I could not get the legend to show up on the page in any way, even after directly searching the command. Otherwise, this chapter also went fairly smoothly.
Potential Applications
A few potential applications for the data in this chapter are compiling crime records in a given area in an easy-to-read way, especially with the inclusion of multiple charts. Dashboards also can give live data about an area, such as outages (which I have personally seen applied when in a Spectrum outage) or in an natural disaster with avoiding certain areas. Another application is seeing the population maps of certain endagered species in the context of time, such as watching the range of Florida panthers change or watching the species’ gradual range migration due to climate change.