Villanueva-Henkle Week 4

Week 5 went with no issues, a very simple chapter, but definitely a useful tool for moving data into the cloud and formatted correctly. It describes using Vector and Raster tile layers, which is which, and what use cases each are best suited for. I only wish that the tutorial didn’t require ArcGIS. Week 6 was also pretty self-explanatory, though I had issues getting the actual slider to work when playing the data. When I moved it myself, it would show a change, but it didn’t show any data on its own. Though it was interesting to work with temporal data and see how it could be mapped.


I had an idea to show population growth over time with different forms of transportation. There would be multiple tabs for each. Cars would be measured by the number of cars on the road, Trains would be recorded by track mileage, and planes would be measured by the number of flights.

Villanueva-Henkle Week 3

Chapter 3 went well without issue. It describes how to use the Experience builder and some of the major working parts of it. The widgets made a lot of sense and I liked how they showed so many different and useful ones.  I found the UI of the experience builder to be a bit confusing, but I think it was due to something with my perception and not the app itself. I think this is a very versatile tool that will really help with communication and making maps more accessible to non-cartography nerds. I know I really would have appreciated a website like this in middle-school if I had known about it. 


Chapter 4 had a lot of good information in it too. It talks about all the uses that mobile devices have in GIS, specifically for surveys, collaborative maps, and AR experiences. I think the surveys are a super useful tool, but I find the editable feature layers the most interesting. I think giving the opportunity to coworkers, partners, or volunteers in the community to work on maps with you is an important tool to be used. However, the downside is that you may have people working on maps in different styles when you need one coherent language.

Villanueva-Henkle Week 2

Reading/Working through chapter 1 was a nice review from ArcGIS and week 1. Having a chance to remember all the features that GIS can offer was a good way to get back into the mindset. It was also interesting to learn how WebGIS has evolved with cloud based computing over time, going from stand alone units, to one way communication, to full communication, and finally more complex networks managed by portals. Some of the terms and links in the website have changed since the publication of the book, but nothing unsolvable.


 Chapter 2 was again a nice review of the intro module from week 1 and showed a lot of expansion onto those ideas. The living atlas looks like it will be a very valuable tool and I’m guessing I’ll be using it often. Tutorials went the same as the first chapter, no big problems.


Based on these chapters, I had an idea for an app that records wildflowers and their locations in parks using crowdsourced data. Users could upload a picture to the app, and their phone would record the coordinates, automatically uploading that data as well. It could also be linked with an app like Inaturalist to identify the flowers. This could be used for hobby naturalists or Natural Resources workers or anything in between

Villanueva-Henkle Week 1

Hi, my name is Rene Villanueva Henkle, and I am a senior at OWU. This week I did the quiz and looked around the ESRI portal.


I had already put in information on my profile in 291, so I did not need to worry about that. It’s nice that there are so many resources available to new users on the ArcGIS site, and that there are many others willing to help as well. 

I’m excited to see other people’s projects on ArcGIS, I remember Dr. Merkel showed us someone’s 1:1 recreation of Middle Earth in her Folklore class, and I found that dedication fascinating. I also think that the aspect of making interactive maps that others can truly connect with is a very powerful tool. 

I had no idea that there were so many different layer types within ArcGIS, I figured that this would be a much simpler program than ArcGIS pro. I will have to spend some time learning about the apps that I can use to help make data accessible.

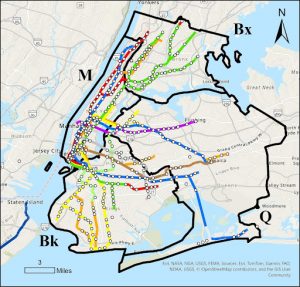
This map shows all subway related fatalities in NYC over a 13 year period between 2008 and 2021. I would have expected there to be much more fatalities per line within Manhattan as it is the densest area, but there seems to be the same amount of deaths along each line, no matter if in Brooklyn or Queens.

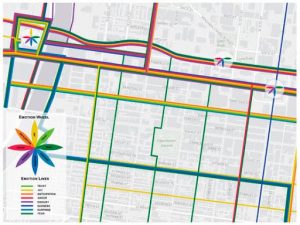
This map shows recorded emotions by travelers when on these commuter routes. The colors indicate an emotion that is shown in the legend. Hotspots are represented by a flower on the map itself. I find this way of looking at cities to be largely beneficial and can really help with urban planning by showing where problem areas are.