Ramirez Week 4

Chapter 5: I learned that even though you can use ArcGIS almost anywhere with an internet connection, a lot of it depends on the public internet but there are times where you can privately use it. Despite it being used publicly or privately, one must be connected to ArcGIS Enterprise. Within the ArcGIS Enterprise there are also many software components such as the Enterprise portal, ArcGIS Server, ArcGIS Web Adaptor and ArcGIS Data Store. Additionally, one can also allow collaborations in order to organize and distribute work. Which is similar to the previous ArcGIS Online cloud as well. 

Application idea: An application idea I have based on Chapter 5 is to create a map and specifically use feature tiles, and caching. I would like to use the raster and vector tile service approach out of the other options. I would choose information that is public so I can use the content delivery network (CDN) to my advantage. I would try to make a population density map of a state or country  and see if there is any correlation between the climate and where people choose to live. 

Chapter 6: I learned about spatiotemporal data, and its categories which are: moving, discrete, stationary, and change. Other terms I learned about in this chapter include the “Internet of Things” (IoT), home automation, and temporal resolution. I also learned more about how smart cars work and how they are connected to the cloud in order to maneuver on the road. Which is something that I did not normally think about.I also learned about a new GIS product called the ArcGIS velocity and it includes new items which are feed, real-time analytic and big data analytic items.

Application idea: I would like to use the Enterprise IoT applications which include environmental quality monitoring, in order to view any animal crossings, specifically like herds or large groups on roads. I would specifically focus on a certain place such as a county within a state. I think I would start by using the ArcGIS poll methods in order to give real-time data to people nearby those animal crossings. Especially, if there are drivers nearby, so it could try and reduce animal collisions and alert the driver to take precaution. 
Ramirez Week 3

Chapter 3: This chapter explores the ArcGIS Experience Builder that facilitates the process of creating projects, templates or map features. Using this tool can be very helpful when it comes to providing data triggers, like 2D or 3D maps or layouts. I also learned that each web app is called a web experience when made from using the Experience Builder. One can customize this and can format it so it  works with other devices. In addition to these web experiences, one can create various forms of widgets and pages to organize their data. I believe this is a helpful tool and I really like that one can personalize it (to an extent) the way they want. Although I would like to know why there are so many editions of the experience builder? Would it not be possible to just put all the features in one edition? 

Application: An application idea I have related to chapter 3 is to use it to create a map displaying floods in Ohio. I would use the Experience builder to create a web experience, and it would include a basic widget to display a map of Ohio floods. Additionally, I think a message action for the widget would be appropriate for this study. That way, the map can be up to date when there is a severe flood in Ohio. Perhaps I would just focus on a city like Toledo since it is near a body of water, and it could also facilitate adding data of one city instead of an entire state. 

Chapter 4: This chapter focuses on using GIS on a mobile device such as smartphones. Some of the advantages of using mobile GIS is that it is more portable, more accessible, and can have more accurate data. However, there is a limited amount of time and digital space available in order to work on mobile applications. The chapter mentions that it is important to adjust the GIS features in order for it to function on the mobile device. One of the ways one can do this is by using feature templates in order to get data. An important aspect of working with GIS on the phone must be to allow permission for some people to add, edit, or delete data. Other topics I learned in this chapter was that GIS can work  indoors or outdoors, and surveys are created using Survey123 Connect. I was surprised to learn about this topic because smartphones are small compared to a PC, so working on a project must be challenging. I wonder what would have been of GIS if we still continued to use PCs instead of mobile devices. Would it have been the same, better or worse? 

Application: An application idea that I have related to Chapter 4 is to create a survey asking college students if they study 15 hours a week. I could use a large university such as OSU to gather more information and get a large range of answers. I would use the Survey123 Connect to help me set up and create the survey. If possible I would also like to follow up with a second question asking where they study the most on the college campus. I have yet to choose which application idea I would like to pursue for Week’s 6 assignment, because  I like them all!

Ramirez Week 2

Chapter 1: GIS is a very commutative platform and it can reach a lot of people from different places and for a low cost. I also learned that GIS is made up of a lot of various coding languages like HTML that can help people access ArcGIS in multiple devices, especially mobile ones. Additionally, the GIS software can be implemented in many fields, such as business, politics or everyday life. I found this informative especially since many people may associate these topics separately. However, the more I learn, the more I realize that these topics are interconnected and GIS is more than just maps. Furthermore, one of the most popular features of GIS is their cloud. Which has become increasingly popular due to online shops. I think it’s interesting how the software can allow many collaborators to work on a single project but is there a limit? Perhaps it was answered previously and I missed it, but it is something that I did wonder about as I read. 

Chapter 2:  The main focus of this chapter was to highlight the importance of using layers to give the GIS maps more depth and accuracy. Some of these feature layers include hosted feature layer, hosted vector tile layers, hosted scenery layers and much more. Although the chapter mostly emphasizes on hosted feature layers from scratch or from pre-existing data. I also learned the different mapping styles which included heat map, color and size map, and vector field maps. These features make it a lot easier for one to create a map and to know which is the better option for certain studies. I also really like that there are tutorials you can use as a reference when it comes to making GIS. Although, one question I have is who is constantly updating these base maps and dates that the ArcGIS web provides to its users. I wonder if they have integrated AI to help it function, or if there are developers that constantly monitor and update their information. I don’t know if it was addressed, it’s possible that I missed it, but it is something I am curious about especially since I think the book was released in 2022.

Application Idea: One possible application would be to look at data centers in the state of Ohio. I would share my study with others on ArcGIS web so others can help me. I believe this would make a lot of sense for a study that analyzes a large place. I would use available online datasets including information regarding, construction, energy, economy, environmental impacts and data centers. From what I learned in Chapter 2, I would create a timeline block on my map to show how data centers, or unfinished data centers affected nearby regions. This subject does involve a lot of interrelated fields, so I would organize my data into different layers as well. This interactive map could demonstrate the consequences of building data centers in Ohio or similar states.

Ramirez Week 1

Note: I completed the quiz, and I completed the other work in GEOG 291.

Introduction: Hello! I am Natalia Miranda Ramirez, and I am a sophomore at OWU. I am from Columbus Ohio and a commuter student. I am also an Environmental Studies and International studies double major. Currently, I am thinking of pursuing a career in environmental law, but that could still change. Outside of class, I have a part time job which means I am either working or doing school work. I also hope that GEOG 292 will help me get a better understanding of GIS software. I had some technological difficulties in GEOG 291, but I hope to do better in this course. 

Comments on Exploring ESRI Account: I like that there are a lot of resources and that I have access to my personal information which I can edit. Plus, there are a lot of collaborations among different areas of study which makes it possible to connect with others. Additionally,  I know there is a lot of  stuff regarding GIS that can get confusing, but thankfully the training page simplifies all the categories and facilitates learning. I also appreciate that there are free courses that teach the fundamentals and basics of GIS. Furthermore, I appreciate that there is a large variety of stories from different fields that one could use for personal reference when it comes to research. 

Examples of GIS in Research:

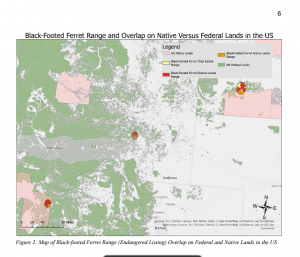
  1. I found this short research paper that compares federal regulations and Indigenous regulations for endangered species in the U.S. This study used GIS mapping to keep track of certain species such as the Black footed Ferret and the Mojave Desert Tortoise. There is some overlap among both regulations when it comes to certain species.  Additionally, there also seems to be a notable pattern, where a lot of these ranges are larger on the west side of the country than the east side. This study is important for comparing land regulations for animals and its  main conclusion is to emphasize the importance of land management in the country. 


Source: https://api.mountainscholar.org/server/api/core/bitstreams/88b1174b-4fd7-405e-86e1-395a4d69c7e5/content

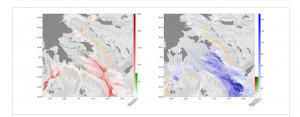
  1. The second example of GIS in research I found was about sustainability development in Norway. In the study, the researchers specifically looked at environmental factors influenced by climate change such as air quality and how to improve it. The study elaborates on the layers, data and specific GIS web that they used to create multiple maps regarding their research. Additionally, this study also analyzed the geography of the country and where and why some places are more polluted than others. It takes into account natural vegetation and anthropogenic factors such as car pollution. Overall this GIS study is helpful when it comes to studying and finding solutions for improving air quality in Norway. 

Source: https://onlinelibrary.wiley.com/doi/full/10.1002/sd.2787

Comments on ESRI Reading:  I like that I can private my maps, especially if it is something I am continuously working on. That way I don’t confuse the public or even community members who want to see my GIS study. I also like that there are tutorials that explain how to use the GIS software. I believe that there are also some video tutorials that can visually demonstrate how to do a certain feature. I really like those step-by-step guides and I believe that they will be helpful. 

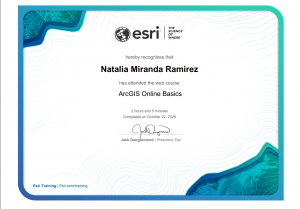
Comments on Training:  I learned about the ArcGIS Apps and external websites that can be helpful to expand one’s current GIS content. I also liked how they demonstrated how to turn a 2D map into a 3D map. Throughout the training, I noticed that there are a lot of terms that are similar, when it comes to using the GIS software.  I remember that some of these functions and terms were confusing for me in GEOG 291, especially at the beginning of the course. Thankfully I learned throughout the course but, nonetheless, I really  appreciate the definitions of the functions, maps, and layers.