Hughes week 4

Chapter 5

Chapter five covers caching and on-premises Web GIS. Different types of map layers are used to help web maps work better. ArcGIS Enterprise is a platform that allows for creating, managing, analyzing, and sharing geographic information among organizations. By using ArcGIS Enterprise, GIS data is managed through organization servers. Raster and vector tile layers were covered again. Each layer has advantages. In the practice, I connected ArcGIS to a portal for publishing layers. I compared different titles and learned to understand how caching helps maps load faster. Choosing the correct layer type is important because it affects the perforation and the interaction of the maps. How does an organization decide if they are going to use ArcGIS Online or ArcGIS Enterprise?
Chapter 6 


In chapter six there was a focus on maps and spatial data being used for real-world applications and patterns to make decisions. I followed the practice to explore geographic information and watched the layers work together. One question I have is how these tools can be used to analyze more complicated problems. When all of the information comes from different sources, how do they determine which is accurate? 

An application I could use this for is showing a real-time traffic map. For example, right now my route to school is shut down and I have to use an alternate route. Many other people treaveling from Morrow County to Delaware are in the same dilemma. By using the information and inputs from other people I could have a real-time map to plan my commute better. This would be similar to how GPS shows roads in red that are backed up. 
Hughes Week 3


Chapter 3

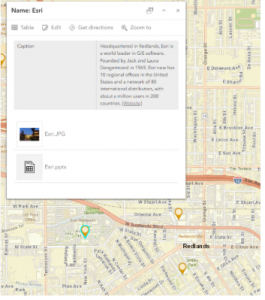
One of my key takeaways from Chapter three is that applications can be changed and customized without needing to understand coding extensively. This makes GIS accessible to anyone who understands geographic data and has a limited working knowledge of programming. Combining maps with charts and lists all under one application is really a good idea. Applications can also be made interactive so that data can be explored instead of just viewing a map that can’t be changed,. What I don’t understand is how these customizations are possible without coding things. 


Chapter 4

Web AppBuilding gives a way to create GIS applications that are interactive through the tools and widgets. This is useful because it allows you to add functions based on what information you are hoping to communicate. How do  you determine what application builder is best for each project? 

The biggest takeaway from the reading is that Web GIS allows interactive ways to view data and that helps people understand it better. The applications allow for combinations of map, charts, and tables so that it doesn’t seem overwhelming to look at data. I think this makes GIS more accessible to other people as well. This allows for going beyond presenting a map with an expectation of understanding and allows the opportunity to click around and explore on their own to fully grasp the information. 

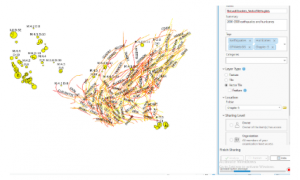
A cool application would be to track hellbender sightings and their movements through Ohio riverways. GPS locations from recorded hellbender observations would display and how those locations change over time. An interactive map would show sightings, which a chart shows observation dates, the tracking number of the individual hellbenders, and how far they moved. Then the data could be filtered based on individual hellbender, river location, or data. This could work similar to how people “adopt” a shark or sea turtle. This would help bring in money for restoration of the hellbender population, but also help monitor hellbender behavior, populations, and environmental conditions that cause movement. 

Lane Hughes Week 2

In chapter 1, the basics of Web GIS are covered and how it can help people find geographical information.  I learned that Web GIS helps people understand real-world problems using maps. I think Web GIS is useful because it’s easy to access for everyone and easy to share information. My only question is who is it much different from traditional GIS?

In chapter 2 we learned about the technology related to Web GIS. Web GIS uses different components such as web browsers, serves, map, and geographic data to share information. People can interact with maps without needing any special software. I think this is really interesting because it makes it accessible to everyone. My question is how do Web GIS servers update the information as things change?


I think an application I would use this for is showing the recreation areas in a particular area and mapping where I could climb and where I could hike. Using data I could mark locations with trails and locations where climbing is permitted. This would allow users to click on each location and view the information. 

Lane Hughes Week 1

My name is Lane Hughes. I am a senior Environmental Studies major. When poking around in my account I saw that there are training options available in eight different areas. I used this time to update my profile a little bit because my name changed. I also saw that there are forums, including a Young Professionals forum. ArcGIS Online was developed by Esri and will allow for the creation of maps on a web browser. This information can be used for analyzing and measuring location information. By using a web browser, data can be collected with mobile tools. ArcGIS Pro is integrated into ArcGIS Online. 

From this I learned that ArcGIS Online will allow you to create, manage and share the data. Layers are the primary way to work with the data. Operational layers display information like trees, roads, and bicycles routes and basemaps provide information and context. Creating and styling a map also sounds interesting. 

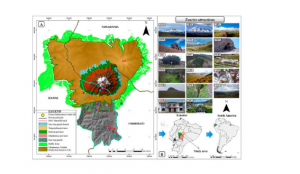
Using Google Scholar I looked up ArcOnline and Climbing Routes in Ecuador. I looked this up because I am going to be mountain climbing in Ecuador at the end of this semester. 

Castillo-Vizuete, D., Gavilanes-Montoya, A., Chávez-Velásquez, C., Benalcázar-Vergara, P., & Mestanza-Ramón, C. (2021). Design of Nature Tourism Route in Chimborazo Wildlife Reserve, Ecuador. International Journal of Environmental Research and Public Health, 18(10), 5293. https://doi.org/10.3390/ijerph18105293

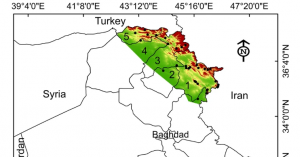
I also looked up ArcOnline and Porcupines and found the following source and map:

Khwarahm, N.R., Ararat, K., HamadAmin, B.A. et al. Spatial distribution modeling of the wild boar (Sus scrofa) under current and future climate conditions in Iraq. Biologia 77, 369–383 (2022). https://doi.org/10.1007/s11756-021-00936-1 

w

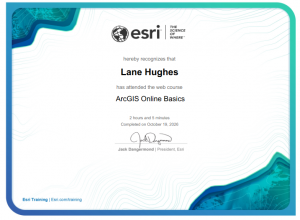
I completed the quiz for week 1!