Brandon Elliott Week 4

Chapter 5, Caching and on-premises Web GIS, begins by using ArcGIS Enterprise, which allows you to create, manage, and share maps and spatial data. I began this tutorial by adding a portal connection by clicking Add Portal and entering the URL that the textbook provided. After adding the portal,I published a vector tile by inputting the information from the tutorial. Sharing this vector tile allows everyone to be able to view this web layer. Following this step, I then published a raster tile layer and compared both the raster tile layer and the vector tile layer to view the differences between the two tile layers and concluded chapter 5’s tutorial. 

Chapter 6 I found to be slightly more engaging than the previous chapter but was also more challenging for me. I began this tutorial by creating a web map, then following by creating a dashboard app and adding a meter gauge that makes the data easy to interpret. This dashboard app, when finished, compiles the map, data, and various diagrams and gauges into one page that is easy to read. After this step I added a category selector using the Add element button once again. This allowed me to configure actions and targets for this dashboard. The next step, configuring the advanced format using arcade, I found to be the most difficult section of this tutorial because I missed a small section of the code that the textbook tutorial said to copy which caused it to not work properly so I had to go back and try again. After this step of copying and pasting the code, the next step was to create a time-enabled feature layer, which required viewing the data layers and navigating to the chapter files and adding the new item. To finish this chapter’s tutorial, I animated the time series data, which gave the map the navigable time window to view the differences between the years.

Using the concepts from these two chapters, an application of these concepts could be a historical comparison of a city’s development using these dashboard apps. Creation of a dashboard app that displays a historical overview of a City’s development over the year while utilizing the various gauges and data display that we used in the chapters would allow for an understandable format to view the map.
Brandon Elliott Week 3

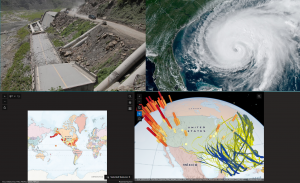
The first tutorial for this week within chapter 3 was all about using ArcGIS Experience Builder to create an interactive page of Historic National Disasters using data, maps, and information. I found this tutorial to be the most interesting so far because I could use my creativity to create my own page. The first section of this tutorial discussed how to add widgets and insert maps that displayed these natural disasters. The next part was about configuring the map actions, which I found to be one of the more challenging steps because I had trouble with inputting the correct values. Step 3 was also quite challenging because of all the different texts you needed to enter in order to complete this section properly. Steps 4 and 5 were both about configuring the widgets, which were straightforward and simple, but consumed a lot of time with all the steps involved. The final step of chapter 3’s tutorial was about navigating and finalizing the page to finish the Historic Natural Disasters interactive page. A real world application of this may be if an environmentalist needs to create an interactive page to demonstrate effects of certain practices that a business is utilizing. Using Experience builder you could create a page that shows maps, images, data, and descriptions with a simple format that is easy to understand. 

Chapter Four’s tutorial was a little less engaging than chapter 3 but was a little easier for me to complete. I began by creating a survey that allowed me to collect data that I would need for the next steps. Step 3 was the easiest step that involved creating a feature layer using the data and labeling it injury type. I then configured a web map then collected data using the ArcGIS fields mobile app. Using Quick capture, I created a project, that I then compiled and prepared my data. Finally, I utilized AR and viewed a map of the data layer that I created. A situation where this could be used is if a city wants to create a mapping of public transportation routes and what people prefer to take and compile the data into one project. In the tutorial I created a survey in order to collect my data, if the city were to do this and collect the data of what the citizens recommend as well as basic data and compile it into quick capture then they would be able to map out this data. Because quick capture can recognize things like street signs and and roads, this would be perfect for giving users the ability to see which public transportation lines are closest to them.

From the first four chapters of this book, the idea that I will be creating for the Week 6 submission is using ArcGIS Experience Builder and my example of an environmentalist creating a page to promote sustainable practices by compiling data and maps. I chose this example over my other 3 because I connect the most with these ideas and goals, and I believe that I will apply more personal effort to create this app.

Elliott Week 2

Chapter one’s tutorial was all about creating a web app on ArcGIS that compiled the work throughout this chapter. I began by creating a feature layer, then adding the fields and attributes, which I found to be the most challenging section of this tutorial. I then created the web map, adjusted the symbology and created the instant web map to finish out this tutorial. The purpose of doing this is that it allowed me to create a compacted source of data and information that anyone is able to view and is set in an understandable and easy to interpret format. 

The second chapter dived deeper into using the various tools and features of ArcGIS, like creating a story. I began this tutorial by once again creating the feature layer using the downloaded chapter data from the textbook. After this, I configured the layer by adjusting the map to display arrows in cities’ locations as well as changed the color and middle divider. Following this step, I adjust the pop-ups by entering the given expression and changing the text. After this, I created the story, which was by far the most challenging section of this tutorial. Creating the story involved a lot of inserting web maps, various texts, adding map actions, and swipe blocks. Creating the story allowed me to compile all of this information and data into a very organized and easy collection.

Possible GIS Application

Tutorials two and one focused on how you can compile information, data, and maps into a public display that allows for an easy view of this compilation of information. I could see this being used in a real-world situation like if a service that needs to not only use maps for themselves but also share top others so they can be easily accessible and easy to interpret for others. An organization like the National Park Service requires specific and detailed maps to use for their own needs but also be able to disperse that information to the public so they can use it as well. Creating something like a story or web map app could help create a public composition of this information and maps and include descriptive text and information to help interpret the maps that are being presented.

Elliott Week1

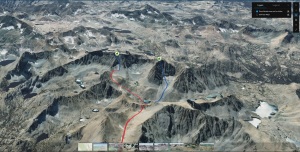
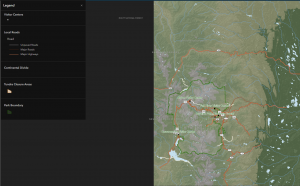
When I went to my ArcGIS Online account and viewed my profile, I first edited my Bio and put a brief description of myself. Within this description, I included basic information about my school: OWU 2028 and a few interests of mine like my hobbies and that I have pets. Intro to ArcGIS Online reading, I took away that ArcGIS  has compatibility with use in the field. And in the “Be Mobile In The Field’ section states how you are capable of creating these maps to be able to be used offline which I found fascinating since I love being outdoors and access to offline maps when there is no internet could be beneficial. I also took away that you can expand your work past just the basic ArcGIS software and use the other range of products that enable you do use other features and tools. The training I found to be very simple and a refresher of what I learned in Geography 291, where I viewed ice climbing routes for a mountain range in Nevada, which I was able to apply to real-world interests of mine like mountaineering and rock climbing. I found that you can use this software to download routes that I may play ongoing, and you can view how long the approach is, descent, and the actual desired route which I will use in the future. I also learned about using the preview app tool to view the app before doing all the work which makes things faster and easier.

What I picked for my own GIS application areas are rock climbing routes in the Smoky Mountains National Park and dog-friendly parks. The first application, rock climbing routes in the Rocky Mountains, is something I can see myself actually utilizing Arc GIS so I can plan the trip and how long the approaches to the routes are as well as how many pitches there are. I use the preview map option to briefly look over the map and inspect the different routes. The second application, dog-friendly parks, I chose because I have dogs and not all parks are inclusive to pets, so being able to view which ones are and plan accordingly with that would be helpful.

https://www.arcgis.com/apps/mapviewer/index.html?layers=be14734a894c41bfbbd9061a2243bb9b

https://www.arcgis.com/apps/mapviewer/index.html?webmap=cb847e2e4a824bd69e8fad1e683f1014