The first tutorial for this week within chapter 3 was all about using ArcGIS Experience Builder to create an interactive page of Historic National Disasters using data, maps, and information. I found this tutorial to be the most interesting so far because I could use my creativity to create my own page. The first section of this tutorial discussed how to add widgets and insert maps that displayed these natural disasters. The next part was about configuring the map actions, which I found to be one of the more challenging steps because I had trouble with inputting the correct values. Step 3 was also quite challenging because of all the different texts you needed to enter in order to complete this section properly. Steps 4 and 5 were both about configuring the widgets, which were straightforward and simple, but consumed a lot of time with all the steps involved. The final step of chapter 3’s tutorial was about navigating and finalizing the page to finish the Historic Natural Disasters interactive page. A real world application of this may be if an environmentalist needs to create an interactive page to demonstrate effects of certain practices that a business is utilizing. Using Experience builder you could create a page that shows maps, images, data, and descriptions with a simple format that is easy to understand. 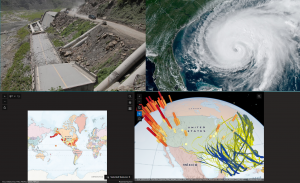
Chapter Four’s tutorial was a little less engaging than chapter 3 but was a little easier for me to complete. I began by creating a survey that allowed me to collect data that I would need for the next steps. Step 3 was the easiest step that involved creating a feature layer using the data and labeling it injury type. I then configured a web map then collected data using the ArcGIS fields mobile app. Using Quick capture, I created a project, that I then compiled and prepared my data. Finally, I utilized AR and viewed a map of the data layer that I created. A situation where this could be used is if a city wants to create a mapping of public transportation routes and what people prefer to take and compile the data into one project. In the tutorial I created a survey in order to collect my data, if the city were to do this and collect the data of what the citizens recommend as well as basic data and compile it into quick capture then they would be able to map out this data. Because quick capture can recognize things like street signs and and roads, this would be perfect for giving users the ability to see which public transportation lines are closest to them.
From the first four chapters of this book, the idea that I will be creating for the Week 6 submission is using ArcGIS Experience Builder and my example of an environmentalist creating a page to promote sustainable practices by compiling data and maps. I chose this example over my other 3 because I connect the most with these ideas and goals, and I believe that I will apply more personal effort to create this app.