Evans Week 1

I am Claire Evans, a second year Environmental Science major and Art History minor. I took GEOG 291 last quarter.

I created my account for accessing the Community page and found that the link to ArcGIS Blog leads to a 404. The Help page seems like it will be helpful if I forget something basic from the first course and want to re-learn it.

The Notebooks creation seems interesting, though I don’t know any Python so I doubt I’ll use it. I’ve learned that a floor-aware map is a map that shows different levels of a building, such as the polygon of the general building shape and the floor plan inside. I’m interested in architecture, so this seems like a fun tool to play with.

It’s interesting that you must turn off searching only within the organization; it’s useful if you are working with organization specific data but less helpful when learning the program. When I accidentally clicked out of the course, it made me start from the beginning again, so that’s something I’ll have to keep in mind.

Integrating CAD data with ArcGIS seems neat to me because I remember thinking that the CAD integration in GEOG 291 was cool. The Systems Approach to ArcGIS: Architecture Pillars sounds cool too because I like architecture. Python 101 for AcrGIS could be a useful course, since I don’t have any coding experience and it could make me a more competitive job applicant.

Applications of ArcGIS:

Using GIS and Open Web Resources the Reconstruct Great Tang Records of the Western Regions

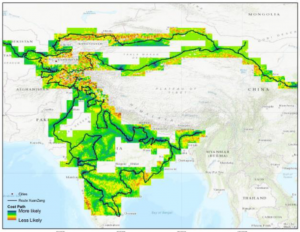
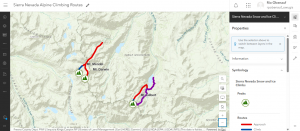
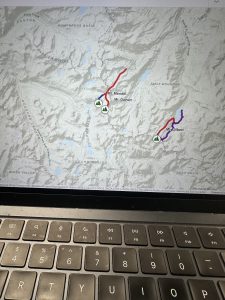
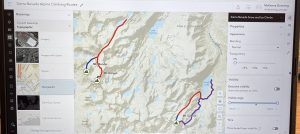
This paper uses ArcGIS and the biography of Buddhist pilgrim XuanZang to map the locations of many city states and monasteries and uses topographical information to see what routes he likely took between them based on what would require the least amount of climbing mountains or particularly rough terrain.

Generation of a Multi-Scale Historic BIM-GIS with Digital Recording Tools and Geospatial Information

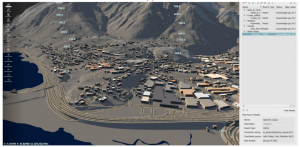
This project used ArcGIS and BIM to 3D model a historic Romanesque town in Italy for UNESCO information and further analysis, since it was difficult to properly model the town using more basic tools due to the large size of the land area and the unusual features of the buildings.

Obenauf Week 1

Hi, my name is Rio and I am a sophomore majoring in Sociology and Environmental Studies.  This is my second GIS course. I took the Desktop class earlier this semester.

I completed the quiz, and took Geog 291, so I did not schedule an appointment for weeks 2 and 3. I also already have access to my OWU ArcGIS online account from earlier this semester.

I had trouble finding the areas we were supposed to look at on the ArcGIS Online website and while I was looking I found past student projects which were really cool to see. 

The Introduction to ArcGIS Online was helpful for understanding what is possible with the software and how to access it. 

The ESRI training was very informational and very easy to use. Directions were clear and concise and it was easy to navigate. 


Using ArcGIS Online for wildlife monitoring and conflict mitigation allows conservationists to track species, map habitats, and manage human-wildlife conflicts through real-time data collection, analysis, and visualization

https://doc.arcgis.com/en/arcgis-solutions/11.1/reference/use-conservation-outreach.htm#:~:text=a%20protected%20area.-,In%20a%20browser%2C%20sign%20in%20to%20your%20ArcGIS%20organization%2C%20and,Review%20the%20incident%20details

ArcGIS Online enables habitat  conservation and land use analysis by providing cloud-based tools to map, monitor, and model environmental data. It is used to identify biodiversity hotspots, track habitat changes over time, create suitability models for restoration, and visualize environmental impacts using Global Forest Watch or ArcGIS Living Atlas data.


https://wildvirginia.org/how-environmentalists-use-gis/#:~:text=GIS%20models%20are%20used%20to,decision%2Dmaking%20for%20sustainable%20planning.  


Deem Week 1

My name is Andrew Deem and I am a first year student at Ohio Wesleyan. I am majoring in botany with a minor in environmental studies because I enjoy being outside and find plants particularly interesting. I am from Marion, Ohio and took GEOG 291 earlier this semester. I have completed the quiz.

Esri account:

Comment 1 – The first thing I noticed about this website is that all of the links around the profile area took a lot longer to load than other links for some reason.

Comment 2 – I noticed that the links for “My Esri” and “Profile and Settings” led to the same place.

Getting Started:

Comment 1 – This portion reminded me of some of the basics I learned in the geography 291 course and refreshed my memory on this topic.

Comment 2 – I noticed that our accounts have access to a number of apps related to ArcGIS, so I wonder if those will come up later in the course.

Esri Training:

Comment 1 – I found that this training helped me to remember some of the details about the class I took earlier this semester as well as teaching me a few things about how ArcGIS operates.

Comment 2 – I can see how ArcGIS and other Esri applications could be useful in corporate or other group oriented careers. I learned a lot more about the group functionality of these services in the web course.

I was able to find some GIS applications related to my interests, such as this one which shows the return amount from corn and soybeans that was expected in 2015. The map shows a large portion of the midwest and east coast and demonstrates how some areas performed better than others in terms of profit that year.

This map shows worldwide deforestation from several causes. Maps like this are useful for getting a point across quickly, such as in this case showing how South America and parts of Africa have been greatly affected by deforestation.

Conflicting Data: How Fast Is the World Losing its Forests? - Yale E360

Ogrodowski Week 1

Hi! I’m Lily Ogrodowski, and I’m a first-year Environmental Science major and Chemistry minor. I took GEOG 291 earlier this semester, so I have already created and am familiar with my ArcGIS account, and I took the introductory quiz.

ArcGIS Online Website Exploration

From poking around the ArcGIS Online website, I was excited to learn about the ESRI Community website, which allows you to discuss and ask questions about topics with other people in the GIS community. It seems like a really efficient way to collaborate and solve problems!

Additionally, on the Scene tab, you can create your own scene or explore one of the preloaded ones. I was intrigued by the 3D model of Boston, and it was incredibly detailed! Like Google Earth but better. One of the preset views was color-coded, so it must be possible to add layers and features to a 3D scene, which seems like a really interesting concept.

Get Started: What is ArcGIS Online?

It seems like ArcGIS Online is more geared towards project sharing and collaboration than desktop ArcGIS was. Because it is web-based, it is probably more widely accessible (even on mobile!), and files get uploaded or shared to the cloud instead of just being saved onto your computer. 

I also really like how the site enumerates real-world problems and then links to a tutorial for mapping the associated data. For example, the site piques your interest in reducing an invasive weed, then provides you with a tutorial on how to map campgrounds that are particularly affected so that action can be taken. How cool!

One more thing: while reading about using the Scene feature, I thought it was really interesting how you can adjust the sun’s position. Watching a day, month, or year in the intended area to see how much sunlight it gets is pretty fascinating to me. Especially in regions near the poles where levels of sunlight are highly variable throughout the year, this seems like a really interesting study.

Web Course: ArcGIS Online Basics

Figure 1: My certificate from completing the ArcGIS Online Basics Course.

Real-World GIS Applications

I was thinking about ice cream while doing this work, and I decided to look up GIS applications on ice cream…which were unfortunately lacking. However, it led me to an article discussing an apparent prevalence of fast-food restaurants near high schools in Santa Clara County, California. The study concluded with the help of geographic analysis that high schools with more fast food restaurants clustered around them actually have higher obesity rates.

Figure 2: Map of Santa Clara County Fast Food Restaurants (pink dots) within a certain distance of High Schools (black flags).

Some of my favorite hobbies include fiber arts, whether they be knitting, crocheting, embroidery, or the like. I found a super cool article where a person hand-embroidered GIS-generated maps depicting a bike route along the Mississippi River.

Figure 3: Hand-embroidered, physical renditions of a GIS map of the Mississippi River. How cool!

Sources:

Nixon, Hilary, and Lauren Doud. “Do fast food restaurants cluster around high schools? A geospatial analysis of proximity of fast food restaurants to high schools and the connection to childhood obesity rates.” Journal of Agriculture, Food Systems, and Community Development 2.1 (2011): 181-194.

Biggs, Heidi. “Stitching Together Body, Land, and Data through Embroidered Geographies.” Proceedings of the Twentieth International Conference on Tangible, Embedded, and Embodied Interaction. 2026.

Koob Week 1

My name is Jenny Koob, I am a freshman at OWU and an Environmental Science major with a minor in Geography, and I am hoping to add another minor in Economics as well. I took GEOG 291 in the first half of this semester, and I learned a lot about the basics of ArcGIS, how to operate its functions, and more about geospatial data in general! The information I gained from the course helped me feel more confident in my geography minor. As I completed GEOG 291, I read the text Getting to Know Web GIS 2022, 5th edition. I have also completed the quiz and all the preparation requirements needed for this week.

I spent a bit looking around the ArcGIS website and found a lot of previous posts from past years: OWU campus maps for both “outside wifi” maps and “teaching spaces”, as well as maps from Geography 353 with data for trees, water, census, etc. To my account, I added more to my Profile, such as my nickname, a profile picture, and a short description of who I am. Under “Training,” I found it really cool that there’s a place to go for an opportuties toward individuals and groups in GIS that can help better understanding and attain goals. Another thing I found was under the ESRI community, you have access to tons of people’s ideas, where individuals have posted ideas on skills or developments, and you can even add your own post idea to the community! Overall, it was pretty easy to navigate the website, not only because I have used it before, but all the mechanics are all easy to follow and to the point.

I also read the “Get Started: ArcGIS Online”. The reading explains everything ArcGIS Online includes, such as creating web maps, web scenes for 3D data, making web apps, notebooks, and more. I like the option of sharing and collaborating, allowing individuals to share content and work as groups if they want to, while also leaving room for those who want to keep their work private. WebGIS also allows the user to create map areas for taking maps offline, and allows editors to get the latest updates on maps. I lastly just really like how accessible ArcGIS Online is, being able to pull it up quickly on a web browser and mobile devices is really convenient.

I also completed the GIS training course in ESRI, and it took me longer than I anticipated! I learned a lot about what makes parts of the GIS mapping important, and the tests really made sure I was paying attention. I took a screenshot of my completion as well. 

I also found two articles in Google Scholar that I think are really interesting!

The first is an article called “Participatory GIS to inform coral reef ecosystem management: Mapping human coastal and ocean uses in Hawaii,” and basically discusses coastal ecosystem management as well as how GIS, or PGIS, is used to track human-caused effects on the corals! I found this article by searching “ArcGIS coral reefs,” and it was credible as a highly cited work. 

Here is the link to the article:https://www.sciencedirect.com/science/article/pii/S0143622814002884


The second article I found was on honeysuckle, a known invasive species in Ohio and many parts of the US. This article was based on research done in Cincinnati, OH. It discusses the importance of early detection in invasive species, as well as how remote sensing methods can be a valuable tool for increasing knowledge about spatial patterns and predictors of invasion!

here is the link to the article:”Detecting Invasive Amur Honeysuckle in Urban Green Spaces of Cincinnati, Ohio Using Landsat-8 NDVI Difference Images”  https://doi.org/10.3368/er.38.3.139

Figure 1.Figure 3.

Askill Week 1

My name is Alida Askill and I am a junior majoring in Environmental Science and Zoology.  I have taken the first module of this course, but it’s been a few semesters. I have completed the quiz. Since I took GEOG 291, I am already familiar with my account. 

 Get Started: What Is ArcGIS Online

Comment 1: What really stuck out to me is that you can view time maps, and the website gives instructions on how to do that. It’s important to be able to see maps over a certain period of time to draw the correct conclusions for the experiment. I also kept scrolling down and the create map section is going to be very helpful because it lists the five steps on how to create a map. The basement is the first step, followed by layers, styles, pop-ups, then saving the map. 

Comment 2: 

I looked into what an Arcgis notebook is, and I think that might be helpful to compile data if there are multiple maps and charts to use and look at. You can also easily share notebooks. 

Web Course: ArcGIS Online Basics

Comment 1: Layers, maps, scenes are all important to use in creating a map image. You need to know what layer to use when and for what specific type of map and project. 

Comment 2: The activities were helpful because it’s been a while since I have used GIS and have forgotten where some of the tools are. This is a beginner level course so it’s perfect for a walk through. 

The first source I found is about sea turtle nests on a coast and where they can nest. The source is called Site Suitability Analysis for Sea Turtle Nesting Area by using AHP and GIS. Temperature of the sand, vegetation cover, beach slope, and sand particle size are all important factors in where sea turtles can make their nests on the Malaysia beaches. GIS can determine all of these factors. 10.1088/1755-1315/1217/1/01203

The second source I found is about the artificial reefs and beach restoration happening in Martin County, Florida. GIS is used heavily in ideas like this because it’s really easy to go back in time to see old maps and compare the habitat destruction to see how humans have the ability to now try and rebuild that habitat. Sea turtle populations are diminishing across the world and one of the factors to talk about is the fact that their nests are being disturbed by dogs and beaches are being destroyed. This makes hatching nests hard and reproduction even more so. https://www.fsbpa.com/2014TechPresentations/Carvalho.pdf

Mason Week 1

My name is Natalia Mason, and I am a freshman majoring in Zoology and environmental science. I have an extremely strong interest in entomology and it is something I really enjoy learning about; although, zoology as an entire umbrella term is something that I find cool too. I had taken the desktop ArcGIS class and admittedly found it a tad bit difficult, but I have heard this class is more manageable, so I am looking forward to that. I have taken the Geog 292 quiz, looked through the ArcGIS online webpage, read through the Get Started: What is ArcGIS Online page, and all other things required of me. 

Upon looking through my ArcGIS online account I had found two things of note. The first thing I found was the community and forums tab that was attached to the account panel. Through it, one can find many resources that mostly seem to be geared towards offering map creation tips, and remedies for issues one might encounter when creating their own map. I feel as though this could be a vital resource, as it offers support in many different issues I may encounter, or helps me prevent possible mistakes in map creation. The help tab also seems to be a useful tool, as it offers support, without being generalized like the community and forums tab had been. It allows the user to search specific information and issues they might have encountered, while pulling data from existing tutorials. 

I had read through the entirety of the get started page, and I found it to be relatively informative. A very interesting feature that the web design of GIS offers is offline accessibility. This feature is particularly geared towards field workers that collect data, so they are able to view and add data to their maps without having direct connection to wifi. I think this is a very smart feature to add because ArcGIS is geared towards a large population of natural science researchers. It also prompts me to wonder if this is a feature I will find useful in the future as I also intend to conduct field biological research. The second piece of information I found notable was the collaborative aspect of map creation. One way to do this is to set up groups that fall under the invitation only category in order to have multiple collaborators on a single map.

The ArcGIS Online basics tutorial showed me various things. One was that this application also offers base maps that an individual can apply to their map to convey a particular idea or to improve readability of their map. These basemaps can range from streets, to oceans, as the user has a large variety at their disposal. This is something that the Online GIS application has in common with the Desktop application. The second interesting feature to learn about was the distinction between a basemap layer and an operational layer. The former means a layer that acts the same as a backdrop, while the latter means a layer that contains some form of informational data.

By searching up ArcOnline and beetles on google scholar, I found an interesting article that dives into the spatial distribution of Pine Beetles. The beetle in question is an invasive species in western Canada that gravely harms the forestry industry, so researchers had analysed their spatial distribution, in order to know which areas needed the most action in order to stop the infestation. The researchers had utilized ArcOnline to produce their maps.

Article Source: https://d1wqtxts1xzle7.cloudfront.net/48668176/19134-65422-1-PB-libre.pdf?1473331031=&response-content-disposition=inline%3B+filename%3DSpatial_Analysis_of_High_Resolution_Aeri.pdf&Expires=1773954442&Signature=HxGQITCBNeUakJtqs-LHLOl6PMBXMyqJNXhC-ChZQbswiod48JMZpG7w42WQ3Bgkua5Nbsm9OZlEAN-01QAC~W2nuQPNx1H2JzK57hwcDXWfUjxaoRmyAc7WOccnHdjakQoaHTUwlclzU4RmWNVxR8AoMJmwLij9NF-855E2MT~UIaq99J01oeA7b5IIyF8SI8yEbvnFO4LbSWDwfcZG8i7oPCgw~k9-1-n4R~r8MeqWwri5IybVXrUcsEEuRXeiLmCX3dFK3J8C~fK1FxDWExGuJprjE0nx00H1s5RIvE1V6555f1UoGR93o1XBJQJPqmc0X7YFkAswIqdVGR5Zng__&Key-Pair-Id=APKAJLOHF5GGSLRBV4ZA 

My second article was based on mosquito distribution in different temperatures and climates to see which areas their distribution was most dominant in.  I had found the article after searching “ArcOnline,” and “mosquito.” The goal of this study was to understand mosquito behavior better in order to prevent further spread of mosquito borne diseases. There is a large known correlation of mosquito prevalence near bodies of water due to their semi-aquatic lifecycle, and the study reflected that. 

Article Source: https://onlinelibrary.wiley.com/doi/full/10.1111/tgis.70009

Downing Week 2

Chapter 1 consisted of a lot of similar entry points to GEOG 291 and the book we read for that. I like that at the top of every chapter they provide a list of what is going to be covered. They focused on a lot of definitions with the first part of the chapter which was nice. Web GIS is the combination and GIS (geographic information systems). They then discussed the advantages of using Web GIS, and one of the advantages was that Web GIS is more user friendly and easier to manage than ArcGIS and so far, that is absolutely accurate. They made a point to recognize that GIS is the science of locations: which means that GIS is a science and that GIS has been used for science as an effective tool for making scientific discoveries. I wondered if GIS itself would truly be considered a science? That point seemed interesting to me. 

I liked how in Chapter 1 they provided examples of common uses of Web GIS and ArcGIS Online and how those might show up on a map! That was helpful to see laid out. This whole chapter was very interesting and helpful to understand the background of the whole website and how to use it. There seems to be a lot of knowledge and thought that went into creating this platform, and I like how in depth they went into that. The rest of the chapter seemed similar to the training we had to complete for week 1. I liked how the content types were discussed too, which are data, layers, web maps and scenes, tools, and apps. I also liked how the book gave us step-by-step instructions on how to navigate the website and create different maps and layers. I also liked how at the end of the chapter they included some questions and answered them, so now I know how to do those things too; like finding the latitude and longitude. I think after viewing these things so far, I’d love to do my project on birds and their habitats in some way. One of my articles for week 1 was about birds in Hawaii and their breeding grounds, and it might be neat to do something like that. 


Chapter 2 started with explaining how smart-mapping and storytelling with GIS works. I learned that feature layers can be used and styled with different web apps on Web ArcGIS. Then there was a confusing table that I had to spend some time looking at and understanding, as I didn’t really know what it was at first. After doing that, I realized that the table was telling us how to create web apps, which was cool! The next step was describing the definitions of each type of feature layer, which was interesting because I did not know there were that many different types. You can also publish each of those different layers to the ESRI geospatial cloud. I did have to look up what exactly “geospatial cloud” meant, but it is essentially combining GIS with cloud computing. There are also different types of smart-mapping, which I think I can use in my project. I liked the look of the heat map as compared to density! The codes were a little confusing, but seem similar to R which I am comfortable with. 

I liked how in the second half of Chapter 2 they talked about “storytelling” and the ease of using Web GIS. It seems like the authors of this book know that people don’t appreciate complicated things, and they made it easy to understand and comprehend. It was emphasized that a Map + a Narrative + Multimedia = A Story. This was a cool way to visualize things, and I liked how it was made similar to crafting a story in writing. There are sidecars and slideshow maps, along with geocoding and ways to create a story that you want. They went into examples of how to make these layers using CSV files which I found helpful. The tutorials are so similar to GEOG 291 that they went by quickly and were easy to understand. I thought it was cool how they included information on how to insert and create images over a map! And again they included some questions and answers at the end, which I read through and I felt like that helped as well. After reading Chapters 1 and 2, I do think I’d like to do something with birds and their breeding grounds in certain areas.

Downing Week 1

My name is McKenna Downing, and I am a Zoology major/ENVS minor graduating this MAY! I am on the track and cross country teams as well. I have taken the first module of this course (GEOG 291), and found it enjoyable, so I am excited for this module too. I have completed GEOG 291, and therefore I’ve completed the reading of the course blog and activating my WordPress account. I have also completed the quiz and the necessary actions for this week!

One thing I noticed about the ArcGIS Online website was that there are examples of maps from previous years, including data about trees, wifi, censuses, and floods. I think that’ll be helpful in the future. Another thing I noticed was that the website as a whole should be easy to navigate. It already seems to be a lot less tedious and confusing than GEOG 291 was!

I read through the different sections of Get Started: What is ArcGIS Online and found some cool stuff! The first main thing I went through was the “Work with maps” section, as I thought that would be the most helpful. I found that it seems to be similar to the ArcGIS Pro from GEOG 291, especially with the Settings and the Content panes on either side of the map. I also found that there are keyboard shortcuts which are neat! The second thing I found helpful was the “Work with content and data” section; which again I thought would be the most useful. I found that I can manipulate data to make it visible to others, which is something we could not do in GEOG 291. This would be super helpful if I were to need help or advice on a project!

While completing the training for this course, I was able to notice two things that were the most helpful. The first thing was how to change the controls to edit who can view your work and data; which could be anything from private, group, organization, or public. I thought that was neat. The second thing I found helpful were the activities to do the maps. The one I screenshotted was thorough and answered any questions I had about it. The website seems user friendly and easy to navigate, and I was able to learn more from the training. I attached a screenshot of the map below. I could not get my certificate to show up, so I screenshotted the part of the website that said “Completed”. 

  1. “A Customization of the Arc Marine Data Model to Support Whale Tracking via Satellite Telemetry” – this involved changing the code of the ArcOnline system in order to track marine mammals, and the authors focused on whales. The model that they are creating is called Arc Marine, and when trackers were placed on whales, they were able to track the whales’ movement across the ocean, and know how to edit the format of the website to accommodate that. I have two screenshots for this paper. 
    1. Lord-Castillo, B.K., Mate, B.R., Wright, D.J. and Follett, T. (2009), A Customization of the Arc Marine Data Model to Support Whale Tracking via Satellite Telemetry. Transactions in GIS, 13: 63-83. https://doi.org/10.1111/j.1467-9671.2009.01159.x

  1. “Using ArcGIS as a Conservation Tool for Wedge-tailed Shearwaters (Ardenna pacifica) on O‘ahu, Hawai‘i” – this study involved using ArcOnline to create a web map of the breeding grounds of the wedge-tailed shearwater on the island of O’ahu. The authors created a public map using the website and used it for educational purposes, as the shearwaters have seen a decrease in their population. I have one screenshot for this paper.
    1. Written by: Jennifer Urmston, M.S., Hawai‘i Pacific. Universityhttps://hiaudubon.org/wp-content/uploads/2021/12/Elepaio81.5.pdf