Obenauf Week 6 Final

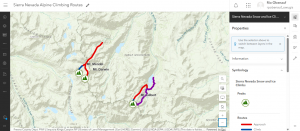
For the first part of my final, I followed the tutorial from chapter one that taught us how to: publish a hosted feature layer from a CSV file and add attachments, add a field to your layer and edit the attributes, create a web map, and create an instant web app using a template. I created a guide to free food locations on the South Side of Columbus, where I am from. There are a significant amount of low-income families and unhoused individuals in my neighborhood. Introducing access to a guide like this will be incredibly helpful for these communities to gain awareness and access to the resources they need. 

https://owugis.maps.arcgis.com/apps/instant/attachmentviewer/index.html?appid=62e87ad6a35248cc995e81d115059f98


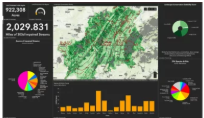
For the second part, using the tutorial from chapter seven, I created a thematic web scene that allows users to understand which states have the lowest and highest population densities and how much population density varies among US states.

https://arcg.is/1G8z5q0 


Obenauf Week 6

Chapter 7 

The 3D world and its advanced forms are making GIS more intuitive, immersive, and useful. In ArcGIS, 3D web maps are referred to as web scenes. This chapter introduces the basic terminology of web scenes and the types of scene layers. Using 3D brings advantages to data visualization, analysis, and communication. Users typically find 3D scenes more interesting and intuitive to interpret which gives 3D GIS a wider applicability in storytelling, urban planning, and many other industries. Based on the visual effects, scenes can be grouped into two main types: photorealistic- which aims to re-create reality using photos to texture features, and cartographic – which takes 2D thematic mapping techniques and moves them into 3D. There are two view modes for scenes, local mode which displays features on a planar surface, and global mode which displays features on a sphere. Scenes have four main types of elements: surfaces which are continuous measurements, typically elevation with one value for a given x,y location; features which live on, above, or below the surfaces; textures which provide exterior or interior covers of your 3D features; and atmospheric effects like lighting and fog. 

Obenauf Week 4

Chapter 5

This chapter introduces ArcGIS Enterprise, its components, and its supporting platforms to build a private WebGIS. ArcGIS Enterprise and organizational subscriptions to ArcGIS Online are complementary implementations of Web GIS. They provide similar functionalities, such as a portal website. ArcGIS Enterprise on Kubernetes is a new deployment option that accompanies Windows and Linux as supported operating systems for ArcGIS Enterprise using microservices and containerization to provide a cloud-native architecture. Map image layers can be drawn dynamically by the server or by using tiles from a cache. Map image layers and feature layers are appropriate for visualizing operational layers. Feature services can generate feature tiles on demand when requested by newer ArcGIS client apps which enable web clients to display more features from the service and provide faster load time by generalizing complex geometries for display. Standards specify the interface that different vendors should use and are an important way to achieve interoperability among different vendors. You can publish web layers using ArcGIS Online and ArcGIS Enterprise web pages directly or using ArcGIS Pro to visualize, analyze, compile, and share GIS data in 2D and 3D environments. 


Chapter 6

This chapter introduces the basic concepts of spatiotemporal data, the values and challenges of loT, and the ArcGIS products that can meet these challenges. The chapter also teaches how to use real-time layers in web maps, create dashboard apps with actions and Arcade-based formatting, create time-enabled layers, and animate time-series data. Spatiotemporal data comes from many sources ranging from manual data entry to data collected using observational sensors or generated from simulation models. Spatiotemporal data includes observations of objects and events that move or change through time such as when and where an observation took place and what activity was observed. loT is the network of physical objects embedded with sensors and network connectivity that enable these objects to collect and exchange data. The science community, the US federal government, and the private sector have embraced the loT to support the creation of systems and products ranging from enterprise applications to consumer applications. An important application of the loT is the smart city which integrates loT technology to make more efficient use of physical infrastructure.

Obenauf Week 3

Chapter 3:

ArcGIS Experience Builder was made to be more configurable and flexible than other apps. This chapter introduces the terminology of the software as well as the layout and templates, etc. A web experience contains at least one page but can also have multiple pages or windows. A page is a document rhat is the foundation for the app’s layout, you can choose from a template. Windows are complimentary to pages and only have body content. A web experience has one theme and each page can have one template. Experience Builder has two types of widgets: basic and layout. Basic widgets are functional and can perform as app tools. Layout widgets are containers that help to organize widgets. 

Chapter 4:

This chapter provides an overview of Mobile GIS and three options for building apps. It introduces Esri mobile apps, and discusses the popular types of apps and frontiers. Some advantages of Mobile GIS are mobility, location awareness, ease of data collection, near-real-time information, large volume of users, and a versatile means of communication. Mobile app development includes many different approaches, browser-based, native-based, and hybrid-based. ArcGIS Field Maps is a new product that combines several previous products. It is an all-in-one solution that can support the different phases of field workflow. 

Application:

I think it would be interesting to use this software to create apps that display environmental quality indicators, such as water quality, air pollution, and proximity to resources. This would be helpful for scientists and policymakers to identify areas and populations that are at risk or at future risk for environmental hazards. This would also be a great tool for the public as they could create buffer zones around their homes and they can see the highest risks in their local area. 

Obenauf Week 2

Chapter 1- Web GIS uses web technologies to make GIS more accessible globally. First developed in the 1960s, GIS has evolved from a local file-based, single-computer system to a central database client/server system. Web GIS offers many advantages such as global reach, large number of users, low cost per user, cross-platform abilities, easy to use and maintain. The common patterns of Web GIS applications include mapping and visualization, data management, field mobility, monitoring, analytics, design and planning, decision support, constituent engagement, sharing, and collaboration. More and more organizations are adopting ArcGIS Online or a hybrid model with ArcGIS Enterprise. 

Chapter 2- Web layers are important because they are the building blocks of web apps which are important because they are the faces of Web GIS. This chapter discussed d=feature layers and how you can style them using smart mapping. Web layers are essentially web services that can be reused in many web maps, scenes, and maps. You should style your layers so that you can deliver the intended messages and your users can discover hidden patterns. Smart mapping enables users to visually analyze, create, and share professional-quality maps easily and quickly with minimal cartographic or software skills. 

Web layers and smart mapping enables urban planners to create 3D simulations of real world scenarios. Tools like ArcGIS Urban create 3D models to simulate zoning changes, visualize population growth, and assess housing needs. 


Obenauf Week 1

Hi, my name is Rio and I am a sophomore majoring in Sociology and Environmental Studies.  This is my second GIS course. I took the Desktop class earlier this semester.

I completed the quiz, and took Geog 291, so I did not schedule an appointment for weeks 2 and 3. I also already have access to my OWU ArcGIS online account from earlier this semester.

I had trouble finding the areas we were supposed to look at on the ArcGIS Online website and while I was looking I found past student projects which were really cool to see. 

The Introduction to ArcGIS Online was helpful for understanding what is possible with the software and how to access it. 

The ESRI training was very informational and very easy to use. Directions were clear and concise and it was easy to navigate. 


Using ArcGIS Online for wildlife monitoring and conflict mitigation allows conservationists to track species, map habitats, and manage human-wildlife conflicts through real-time data collection, analysis, and visualization

https://doc.arcgis.com/en/arcgis-solutions/11.1/reference/use-conservation-outreach.htm#:~:text=a%20protected%20area.-,In%20a%20browser%2C%20sign%20in%20to%20your%20ArcGIS%20organization%2C%20and,Review%20the%20incident%20details

ArcGIS Online enables habitat  conservation and land use analysis by providing cloud-based tools to map, monitor, and model environmental data. It is used to identify biodiversity hotspots, track habitat changes over time, create suitability models for restoration, and visualize environmental impacts using Global Forest Watch or ArcGIS Living Atlas data.


https://wildvirginia.org/how-environmentalists-use-gis/#:~:text=GIS%20models%20are%20used%20to,decision%2Dmaking%20for%20sustainable%20planning.