I have completed the GEOG 291 quiz
Hello! My name is Andrew Deem and I am a freshman at OWU this year. I am from Marion, Ohio which is about a 30 minute drive from campus. I plan to major in botany with a minor in environmental studies because I love plants and the outdoors. I am looking forward to participating in this class and learning more about geography!
Schuurman: This chapter of the book was useful to me for several reasons. Because this is a topic I know very little/no information about, this chapter was able to bring me up to speed on the entire landscape surrounding GIS with a brief summary of its history and how it was gradually developed and accepted in the mapping community. There were times when I was reading that I would be struck with a lot of jargon from this topic that meant little to me, but the author does a good job at providing enough context clues so that an inexperienced reader is able to discern the information anyways. Additionally, I found it interesting how the story of the development of GIS was being told in a way that directly linked it to advancements in computing technology, which made it easier to follow the timeline of events. From this chapter I was also able to gain a greater understanding of how GIS is useful in displaying data in the form of visual information, making it easier to understand. I can appreciate how valuable GIS must be, because I personally see the maps it creates often on the internet. Overall, this chapter taught me about how complicated GIS can be, both GISystems and GIScience are very complex fields which are very important parts of our society and have taken a lot of effort and time to get to the point they are at today. Much of the complexity comes from just how broad this subject is, as while it is foremost a field that specializes in creating maps, it is easily overlooked that ‘creating maps’ in this way requires knowledge on the topic the map is being based on. Because of this, GIS is a highly valuable field that is important to modern life.
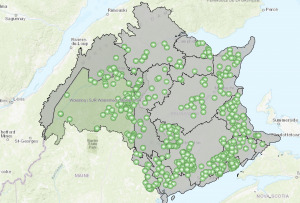
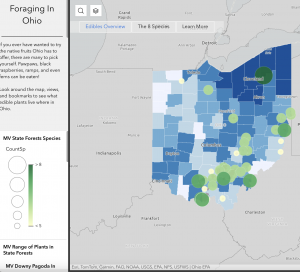
GIS application 1: https://experience.arcgis.com/experience/6933ac08a46d43a0a36372cba29299f1
For my first GIS application, I was able to find a map of edible plants that can be foraged across Ohio, and interestingly enough it was on ArcGIS Online. This directly ties in with my interests of native plant taxonomy and foraging.
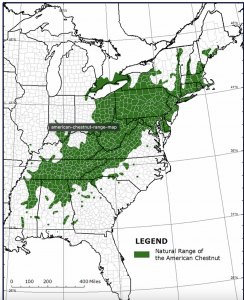
GIS application 2: https://tacf.org/american-chestnut-range-map/
For my second application of GIS I decided to find a map displaying the native range of the American chestnut tree, which has been destroyed by an invasive fungus over the past century.