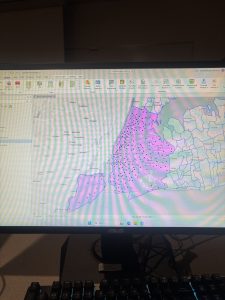
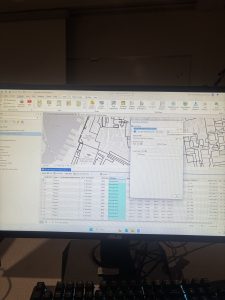
Chapter 4:
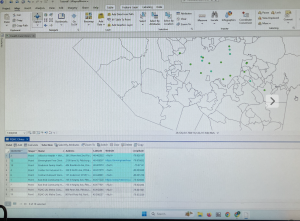
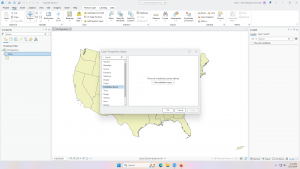
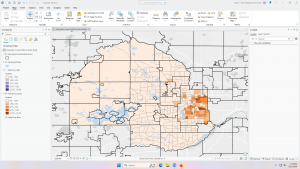
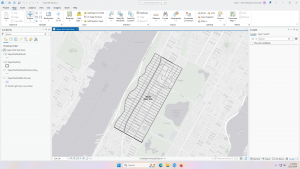
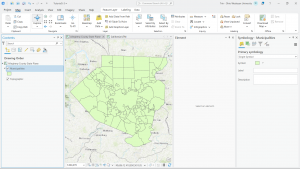
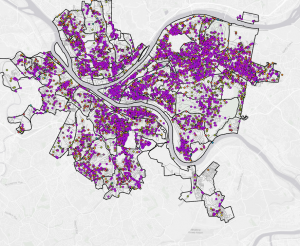
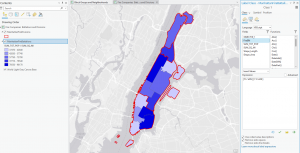
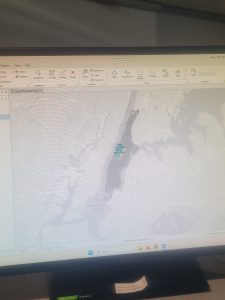
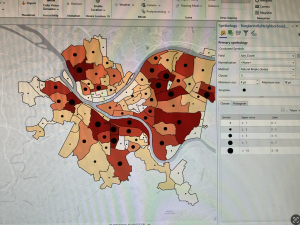
For Chapter 4 (and chapters throughout the manual in this section) It doesn’t show you many examples of what the map is supposed to look like throughout the text; it just simply walls you through a wall of confusing explanation. This makes it very difficult to check if you are doing the right thing, as there is little visual comparison. I made many mistakes because of the exclamation leaving out small but important details with almost nothing to compare it to visually. Chapter 4 was dedicated to file geodatabases, as we created and managed file geodatabases and then edited said data in specific ways using various methods. For example, we modified attribute tables, carried out attribute queries, aggregated the data with spatial joins, used central point features for polygons, and lastly created a new table to join to another table. A new thing about chapter 4 is that the data is not already loaded in on a pre-existing template. We had to be the ones to create it this time, which was a difficult hurdle for me. Especially when I feel the instructions would lead me to a dead end on multiple occasions.
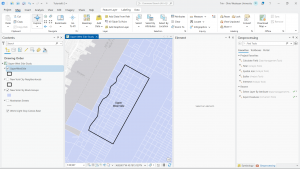
Chapter 5:
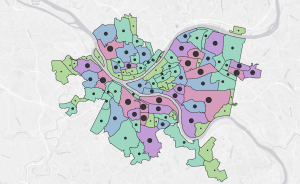
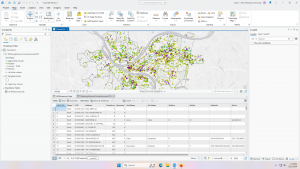
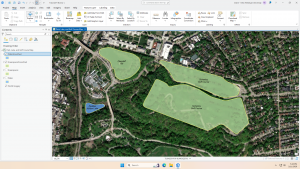
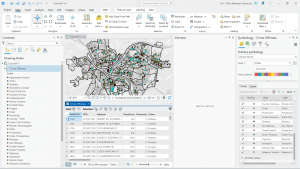
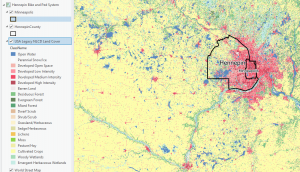
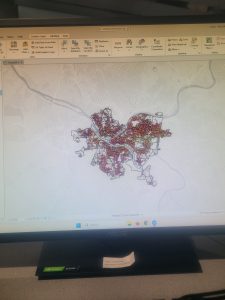
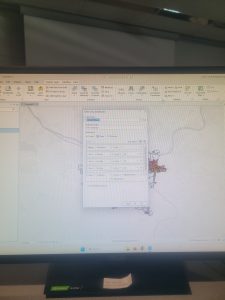
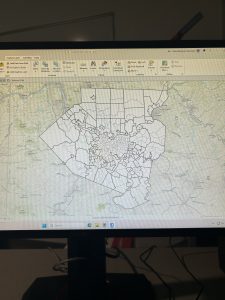
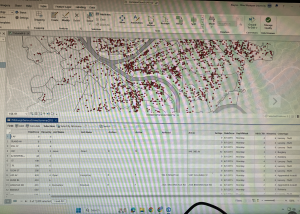
Chapter 5 introduced more advanced geoprocessing tools and focused the reader on spatial data. The focus was on solving spatial problems by combining multiple tools and methodologies. Unlike earlier chapters, where the tasks felt somewhat guided, this one required a lot more attention to detail and understanding of what each tool was actually doing behind the scenes. This caused me to make several errors. For example, in tutorial 5-6, there was an error stating “010819: The input path contains spaces” despite the input being selected from a predetermined dropdown box. There were no instructions to fix this issue. Little errors like this occurred often that stopped me in my tracks because of the detailed nature of chapter 5.
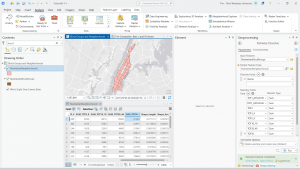
Chapter 6:
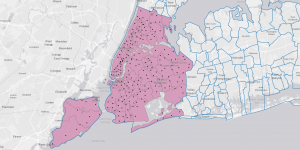
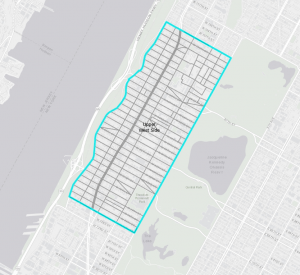
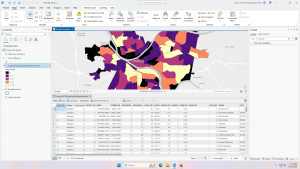
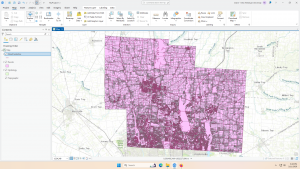
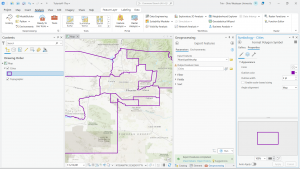
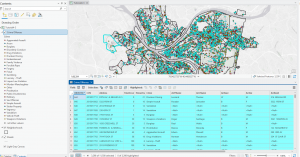
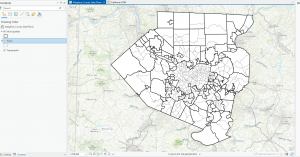
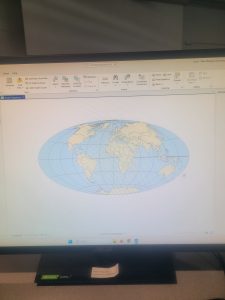
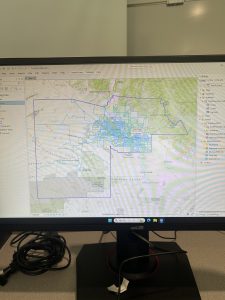
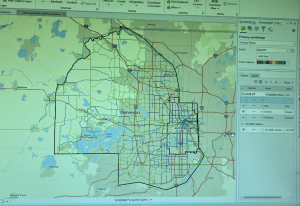
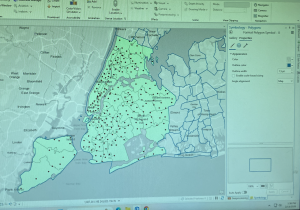
Chapter 6 felt more focused on selecting and analyzing data rather than creating new feature classes. This is becuase chaoter 6 focused on Geoprocessing, which is a framework and set of tools for processing geographic data. I became accustomed to searching for specific tools in the geoprocessing tab, specifically within this chapter, as almost every tutorial section has you using a specific tool you must look up in order to complete the task. This can be tedious, as being introduced to a new tool almost every single section became overwhelming. This, combined with the previous issues of instructions still being very dense and not very visual, as well as not providing workarounds to errors, led to an overall stressful experience for me.