Mitchell Chapter 1:
The most important thing I found from the beginning of this chapter was that GIS stands for Geographic Information System. It allows us to see patterns and relations in geographic data, and is used in many jobs. Using GIS is very helpful in understanding more about a specific place, however you still need the right tools and analysis to make that happen. The first step in GIS Analysis is asking a question. It can be any type of question, and then you simply have to understand your data. Then you choose a method, process the data, then examine the results. I found that it seems very similar to the scientific method.
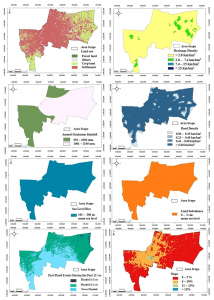
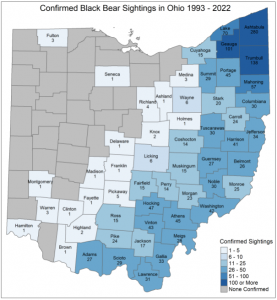
There are different types of geographic features, such as discrete features, continuous phenomena, and features summarized by area. In discrete features, the specific location can be pointed out and is there or not. Continuous phenomena can be found or measured anywhere, such as precipitation. Interpolation: the process of assigning values to the area in between points. Centroids: center points. Summarized data is the counts of individual features within area boundaries. Demographic data in particular tends to come as summarized data, but you can use GIS analysis in order to overlay the data in which you want.
Geographic features are represented in two ways: vector and raster. In the vector model, each feature is represented by a row in a table and X,Y points on the map. Specific areas on the map are defined by borders. In the raster model, the features are represented by cells in a continuous space. The cell size does matter because information can be lost, which I think is interesting. Discrete features are often represented by the vector model. There are many types of attribute values, such as Categories, Ranks, Counts, Amounts, and Ratios. These values matter depending on the map type you’re making. The main tasks we will have to perform are Selecting, Calculating, and Summarizing. The equations are represented in Chapter 1.
Mitchell Chapter 2:
It is important that people understand that mapping is important, but understanding the patterns in certain types of geographical spaces can be helpful with GIS. It is used by police officers, wildlife biologists, and retail analysts. These jobs all have different uses for GIS, and it helps to have categories on the maps to describe the areas and features. You have to assign geographic coordinates and category values to each map, which I think sounds fun! To start your map, you simply have to tell GIS what you want and where you want things. Maps can be very simple, with features that represent simple patterns.
One of the main functions that GIS does is it stores the locations of different features as a pair of geographic coordinates or as a set of coordinate pairs that define area. Using these specific coordinates, you can make symbols at each point and connect them (it reminded me of connect the dots)! Using the data layers and subsets, you can ask GIS analysis to specifically point out what kind of data you are looking for. For example, if you are tracking wildlife migration, you can tell it to focus on one particular animal or route. I also think it’s nice that the GIS will store a category value for each feature in the data’s table layer.
I like how they mentioned that you can only use up to 7 colors, because humans can’t really process more than that, which is fair. It is definitely easier to understand an area with less colors and less features if possible. This can be helped with grouping categories, but we have to keep in mind that some important information can be lost if we combine too many things. The main thing being discussed is simply knowing your data and what categories would make sense together. Choosing symbols is also important! They state that you can use different colors, or shapes, but colors are preferred because they are easier to distinguish. Text labels are also necessary so the audience can see what you see. Overall, it seems pretty easy, but I understand how it could be very picky and difficult to analyze if done improperly.
Mitchell Chapter 3:
At first, I was a little confused at why it said to map the most and the least. But, upon reading more, it made sense because you have to associate the data with quantities of each feature. As discussed in Chapter 1, there are different patterns of features needed to map certain data. There can be dots, colors, shapes, and shading on different maps used for different purposes. Data summarized by area typically are displayed by shading charts. I liked how it also defined the differences between exploring the data and simply presenting a map. You have to understand your quantities, counts, ratios, ranks, and amounts.
One of the next steps in using GIS analysis is to create classes. Counts, amounts, and ratios are typically the data that are grouped into classes. When you map individual values, you can search for patterns within the raw data and also present an accurate picture of the data you are exploring. I think it’s cool that you can group classes together by using the same symbol. The classes also require you to find the upper and lower level, so the class can be used in between those values. You can also use standard classification schemes, which let you look at different patterns in the data using similar values. Some of the subsets of standard classification schemes are natural breaks (jenks), quantiles, equal intervals, and standard deviation.
Each classification scheme has a specific way of identifying the different patterns and groupings within the data. However, to choose one of these, you have to know how the data values will be distributed across the map or the graph. I found that it seems very similar to choosing the correct graph for your data sets in math classes. It appears that we also deal with outliers, and we put those into their own classes. Once you have all this information, you can make your map, yay! Of course, the map types are different as well, and also depend on what kind of data you have. The symbols, colors, shapes, and general charts will all be different for what you are trying to examine. One hint I found useful was using contour lines for continuous phenomena! In the map, you can also edit viewer location and that will make a difference, as well as the Z-factor and the light source.