Mitchell Chapter 1
The introductory chapter, Introducing GIS Analysis, builds a basic framework and vocabulary for working with GIS. This chapter discusses types of geographic features that can be captured by GIS, like discrete features, continuous phenomena, and features summarized by area.
I was most intrigued by continuous phenomena, and I hope to learn more about the concept of interpolation, and how GIS develops the values for areas in between the discrete data points given. I’m probably not the only one who would say that data summarized by area is a rather familiar concept. A common example that comes to mind is the electoral college maps we watch on Election Day, where the magnitude of difference in votes between presidential candidates determines the color and shade of the state or county being observed.
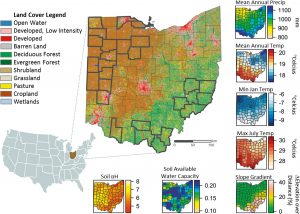
This chapter also introduced me to the differences between vector and raster models. Vector models use coordinate points, which makes them ideal for displaying discrete data. Conversely, raster models seem to capture more nuanced variation in continuous data, which I noticed in the book’s orange and red “Elevation” map.
Mitchell also discusses some common geographic attributes of data. I was specifically interested in ranks; I think it is interesting that this category introduces an element of subjectivity. I can see how this feature would be useful but may be unfit for some situations where data is not very variable. I also learned the difference between counts and amounts—counts are shown on the map, while amounts are numbers that might be associated with something on the map but not actually shown (i.e. on a map of parks, the parks are “counts,” but the number of benches at each park are “amounts.”)
Finally, Mitchell describes some ways to work with data tables containing the information on the GIS maps. Some of these are reminiscent of high school statistics topics, like the uses of “and” and “or” to broaden data selection. Just reading about all of this vocabulary is a bit overstimulating, but it all seems to be very helpful going forward.
Mitchell Chapter 2
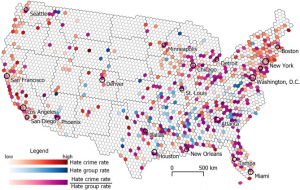
Mitchell Chapter 2, Mapping Where Things Are, describes how to layer and categorize different features on a map, as well as the times and places for differing levels of detail in categorizing features. When developing a scientific research question, perhaps involving a specific hypothesis, it makes sense to use a map with more detailed codes for categories. Also, developing detailed codes as subsets of one category can reveal trends that may not have been visible in the entire data set. On the map of crimes, when all the data points are one category, you can notice some general “hotspots” of crime. However, when you separate the crimes into subcategories, and then isolate each subcategory on a map of its own, you may see that a high concentration of thefts occur on a particular street corner. When planning to solve the problem, a general solution might be deploying more police to the general crime hotspot. However, a more detailed analysis of the GIS data might encourage police to install better security measures like cameras and alarms on that street corner.
The best techniques will vary from map to map, depending on what you are trying to illustrate. When you are looking at a large-scale map, a great amount of detail might make it a little cluttered and overwhelming to look at. However, the general map might spark notice of some basic patterns, which can then be elaborated on in smaller-scale, more detailed maps.
(Side note: I found it interesting how Mitchell mentions that most people can only effectively decipher seven colors on a map at once. I’d say that’s a fair assessment–I’d be curious to do more research on the scientific “why” behind that!)
After reading this chapter and exploring its examples, I can see how GIS is a massively influential tool in analyzing and planning human activity. It seems like land use, transportation routes, and business traffic are three main topics in which GIS can be utilized to maximize efficiency or profit. However, with great power comes great responsibility. Those who use GIS in business or urban planning models must be careful to remember that any alterations to landscape, especially previously unaltered land, can set off a chain reaction of environmental injuries.
Mitchell Chapter 3
Chapter 3, Mapping the Most and the Least, brings topics in the previous two chapters together. It discusses ways to map categories and features, but instead of just looking at where things are or aren’t, Chapter 3 focuses on determining the areas that have the MOST of the target category. This helps the GIS user to determine where to concentrate their focus and efforts.
Mitchell makes an impactful point by stating, “Mapping quantities involves a trade-off between presenting the data values accurately and generalizing the values to see patterns on the map.” I think this is a central question that relates to map-making with the audience in mind. While categories are important to note and map in some cases, many occasions would better benefit from the introduction of category classes. Classes can display areas lying above or below the particular threshold in question, prompting action or study within those areas. For example, there may be several categories for average income within census tracts but sorting those categories into classes above or below the poverty level can convey more helpful information.
This chapter also details the standard classification schemes of natural breaks, quantile, equal interval, and standard deviation. It seems like the optimal scheme for a particular map depends on the qualities of the data set, such as the distribution of features and presence of outliers.
In addition, Mitchell describes different ways to represent quantities on a map. Through graduated shapes and colors, contours, charts, and 3D models, quantities and their proportions can be displayed. There are benefits and drawbacks to each type, but ultimately, all of these methods can show where the target quantity is concentrated, and where it is not. This can inform the GIS user of where to place phenomena such as an ad campaign, a new store, or support services.
This chapter has reinforced the idea that there is no one correct way to make a map using GIS. The best way to develop a model is to simply evaluate your data sets and make multiple models to determine what works best. There is not a clear route to take…but that means there are multiple solutions!