Chapter 1 Notes- GIS use has grown enormously. Spatial data has become more abundant, and we now have new ways to access it using LiDAR and drones. Scientists are discovering that GIS is not just for map-making and geodatabases. By learning to use GIS for analysis, you can obtain more accurate, up-to-date information. By using GIS, you can better understand the place you are studying and make more informed decisions about its future. In the upcoming decades, it is said that GIS will continue to grow and expand our understanding of the world. Chapter 1 also breaks down many different kinds of maps, what they are, and what they show. They also show what they are used for and how to use them. Besides talking about GIS and how it worked, it also gave us websites like ArcGIS, which were pretty interesting to look at. As well as. Living Atlas of the World is another GIS website to look at, which I may spend some time exploring the data they have on their site. Some of the import definitions they gave were for GIS, which, in simple terms, involves analyzing geographic patterns in your data and the relationships between them. They also list the five types of attribute values, describe them, and provide maps showing how each is used. The five attribute values include categories, ranks, counts, amounts, and ratios. Categories are groups of similar things that help you organize and make sense of your data. Rank was described as a feature, ordered from highest to lowest. They also tell us when we should use ranks when direct measures are difficult to obtain. Counts and amounts show you the total number of your data. The count is the actual number that appears on the map, and the amount is a quantitative value associated with the feature of the number. Ratios show the relationship between two quantities.
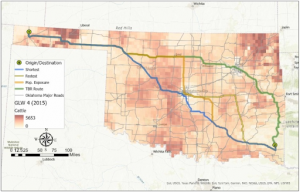
Chapter 2 – Chapter 2 mostly discusses how to use maps in GIS and make them readable for everyone. In the first paragraph of the chapter, it asks why we should use maps and why they are important. The example they used was about the police, where crimes are in the area, and what they were. As they tell us, some helpful things to look for when gathering information for mapping. The book’s example was to see where customers were from, so they could put an ad in that area and attract more customers, which led to more business. As well as telling us when we are mapping, that we should have the absolute location of the area by Gps or coordinates. So we can get the right area, we are mapping it out. One of the points they brought up was to make sure that we give Category values to what they are. To bring it back to the first example, when they were mapping the crimes in the area of the business, what kinds of crimes were they, and where exactly were they happening? When making the map, we can place all the figures on the same layer, but make sure they do not overlap. They point out that when we are mapping, we use different symbols for different categories to avoid confusion. The example they used was roads, where a darker, thicker line indicated a main road and a lighter, thinner line indicated a residential road. The chapter also points out that when we put it all together, the layers may reveal a new pattern between the categories. It says we can use up to 7 categories; anything more might be a little confusing to others when they look at the map.
Chapter 3-in chapter three, they ask why mapping the most and least is important. They explain that having more qualities helps understand and find patterns, and recognizing these patterns helps associate the map with better directions and answers. To map the most and least, you map features based on a quantity associated with each. In the example in this chapter, they give us a company trying to sell children’s clothing. The Company would try to find areas where young families have set up so they could sell children’s clothes to them. Knowing the quantities helps them determine which areas to put ads in or to reach out to more people. This chapter also talks about the things we will be mapping and what they represent. Counts and amounts are one of thing they talked about for mapping. Counts are the actual number of features on the map. Ratios are another type; they show the relationship between two quantities and are expressed as the ratio of one quantity to another. Ranks are the last ones; they are listed in order from high to low. They show relative values rather than measured values. It also talks about creating a class. Once you know your quantities, you can decide what they represent on the map. By mapping individual values, you can make a more accurate map, though it may take more effort and time. Once you know how to classify your data values, you will want to create a map to inform viewers. The chapter shows us the difference between the symbols in maps. Graduated symbols, Graduated colors, Charts, Contours, and 3D perspective views are the. Based on these, you can have a better understanding of what the map is.