Fry- Week 7

This week, without any reading and most likely the same as many of you did, I downloaded and prepared for the GOEG 291 final scheduled to be due next Friday. For this, I downloaded the necessary data from the Delaware County GIS Data Hub: the Parcels data, Street Centerline data, and the Hydrology data. I then organized this into a file labeled “Delaware GIS Data” on my laptop, extracted each dataset from its original zip file, and converted it to the necessary shapefile format. This created a new file folder for each data set that contained the usable data files. Once the files were in a usable format, I then created a new ArcGIS Pro map project and inserted the three dataset files. To do this, I selected the “Map” tab, then the “Add Data” selection under the “Layer” portion. This added each dataset as a layer on the “Contents” tab. Finally, I recolored the imported data layers (as they were all inserted as the same default pink color) to make each layer visible. As for the final project selections, I plan on doing the “selecting and classifying land uses”, “making new shape files from existing shape files”, and “mapping change” choices.

Fry- Week 6

These chapters dive a bit further into the different kinds of analysis that can be done using GIS programs. Chapter 7 teaches us the formatting of different polygon overlays that can be used in an informational GIS analysis. These formatting tools include creating, deleting, editing, and reframing different polygons over satellite images of buildings. Chapter 8 goes over data and data points a little more in-depth than before. With this, we match data points to their accurate match on the map using ZIP codes and confirm the program’s success in matching these points correctly. I found chapter 8 particularly useful for the future, as matching data points is a crucial part of GIS mapping and creating an accurate model for your intended purposes. Chapter 9 was also rather helpful in figuring out different ways to categorize zones of coverage. This chapter covered a variety of ways that zoning coverage can be done and provided very useful steps in completing the chapter. Overall, I think I am starting to get the hang of the ArcGIS program and am fairly confident I will be able to implement such programs in future work. I am eager to implement a GIS map from scratch using my own data inputs rather than provided files as well.

Fry- Week 5

This tutorial book continues to go in depth on how to use GIS and how to use all the little features it has. Chapter four was tough for me; I was struggling to find a few of the attributes or tabs it was asking me to find. When I got to the portion where it asks you to delete the unnecessary portions of the “Tracts” tab, I was unable to, as the “delete” selection was greyed out. I am unsure of where I went wrong, but when I opened the attributes table for “Tracts,” it only showed one variable, while the attributes I was not able to delete were showing in another tab. When attempting to add the “GEOIDNum” field, it also did not show up in the attributes table. This very well could be user error, but I will have to go back to the first part of chapter four.

Chapters five and six, however, went very smoothly! The tutorials were lovely and worked exactly as stated in the text. I do like how the tutorials give you the opportunity to test the lesson with a different outcome at the end of each section. I do find it quite helpful. Chapters five and six dive deeper into the more technical side of using GIS programs by showing us how to change numbering settings, sort through information (by data, type, quantity, etc.), and change layering and location specifics. I am quickly realizing just how many options there are in ArcGIS and can see how each of them is extremely useful to the overall function of the program. I am excited to try to start a map from nothing but data, as everything has been handed to us thus far, but I definitely need more practice with the basics first.

Fry- Week 4

I was excited to get into the real GIS work last week and ran into some technical difficulties, so I apologize for the delay in this post. This group of chapters was extremely helpful in understanding and navigating the ArcGIS Pro app. Initially, I thought the app would be simple and easy to use, but there is much more to it than I expected. However, all these tools are very useful to engage in the full application of GIS. The ability to change formatting as needed and control the layering of each aspect is impressive for creating the perfect visual, regardless of the need. The step-by-step style and many tutorials, including very simple steps is a very nice way of learning GIS programs and helpful for me personally as a very hands-on learner. I really enjoyed how interactive the maps remained even after creation. Being able to zoom in, click on points, and review specific information on an area with a click of a button really shows how incredibly useful GIS is to a multitude of different applications. I also did not know that GIS can be used to make graphs or informants other than maps. Chapters one through three covered a lot of information on the basics of GIS, and it was a very helpful introduction for someone who has utilized very little of these programs before.

Fry- Week 3

CH 4-

Chapter four of the book goes over density in relation to GIS mapping; its uses, formats, and when it’s a good choice to utilize. Density mapping can be a great tool when graphing visuals on populations of various things (i.e., people, businesses, animals, plants, etc.). It can be done by a defined area or by loose markings, which can in turn be symbolized by shading or pinpoint markers. The style chosen is based on the information you are trying to represent. If you are mapping population by county of a certain state, defined barriers would work well. However, if you are attempting to establish a coffee shop in a town, pinpoint markers would be best.

CH 5-

Chapter five goes over “mapping what’s inside”, where information is mapped within a certain defined area, either for data on that region or for comparing regions to one another. This form of mapping focused on one area, but on many things within that area. Chapter five also goes over the type of information and analysis needed, depending on the goal of mapping. For example, do you want everything outside of your desires mapping area to be shown with only the desired area highlighted, or do you want only information to be shown within the desired region? This is once again dependent on the intention of the map. It also goes into how to decide what features to show on your map; are roads important features? rivers?

CH 6-

Chapter six talks about distance and how far out to map from your desired location. It also speaks on what specific features outside of your zone to focus on, depending on the map’s intent. The unit of “distance” you use is also an important factor to weigh in. For something within the natural sciences, this distance can be “meters from a water source”, but for something more anthropocentric, distance might be better measured as “walking time from campus”.


Fry- Week 2

Mitchell Notes 


Ch 1:

  • GIS has become significantly more widespread and readily available since the book was first published in 1999.
  • Although GIS has made such advancements so quickly, it is still fundamentally the same, as how it is used hasn’t changed significantly, which means the original basics of understanding are still necessary to implement GIS tools.
  • GIS will continue to expand, and more books to assist in public understanding will be published.
  • “GIS analysis is a process for looking at geographic patterns in your data and at relationships between features.”
    • GIS can be simple or more complex; maps can be considered analysis or graphing with overlapping data regions.
  • First step to GIS is asking a specific spatial question. 
  • How you explore the data depends on what your intention with the results is (more professional or casual). 
  • It is important to take geographic features into account when analyzing data.
    • “Geographic features are discrete, continuous phenomena, or summarized by area.”
  • Analysis should remain consistent, as in all data points and mapping techniques should be in the same format. 
  • Attributes: identify, describe, or represent a feature. 
    • Categories = groups of similar things.
    • Ranks = order of features, high to low. Ranks are relative.
    • Counts/amounts = total numbers of observations.
    • Ratios = relationship between two observed quantities.


Ch 2:

  • GIS takes information from a table and translates it into a mapping format.
  • The style and amount of information put into a GIS graph are based on the amount of data collected and the question attempting to be answered.
  • The intended audience should be considered when developing maps and figures.
  • Each input needs a geographical place.
  • Mapping symbols must be consistent and have a unique symbol designated to each category or feature type.
  • With more categories, you may need to combine them to make the map easier to read and analyze.
    • The way categories are grouped could change the way the reader interprets the information.


Ch 3:

  • Mapping features based on quantity adds more depth and information to the figure.
  • Goes more into depth on each attribute and how to graph them properly. Also explains each more in depth with examples

Fry Week 1

I’m Trinity Fry, a second-year student majoring in Environmental Science and Zoology (most likely majoring in Philosophy and minoring in Neuroscience soon as well). I am recently back from a wildlife rehabilitation program in Guatemala, hence the delayed post.

Reading:

I found the reading quite interesting, informative, and relatable. As an Environmental Science and Zoology student, I did not think the use of computers and codes was something I would have to familiarize myself with. However, I am quickly seeing that change as the uses of GIS and computer programming are broadening every day. As the text states, GIS is a monumental tool for all kinds of fields. From tracking the natural world to mapping human populations to company advertising, GIS is an extremely useful tool. “Students flock to GIS classes in colleges and universities; on-board navigation systems are the mark of a luxury car; police officers are routinely trained in GIS; organ donation has been rationalized using GIS; epidemiologists use GIS to
identify clusters of infectious disease; archaeologists use it to map sites; and Starbucks is reputed to use GIS to site its very successful coffee shops. Indeed, the list of GJS uses is extraordinarily comprehensive; the technology pervades many aspects of modem life.” (Schuurman, 2004, pg. 1). While this tool may seem straight forward, Schuurman does emphasize that simply having the programing is not sufficient, and like any other application, you must know how to implement its uses to understand and use it to its full potential. This text made me more exited to learn about GIS and its applications in my field of interest. This will be a very helpful tool to me in my future career, and I can’t wait to apply it to real-world case scenarios.

Schuurman, Nadine, “GIS: A Short Introduction” Ch 1, pg. 1-20, (2004) schuurman_gis_a_short_intro_ch_1.pdf
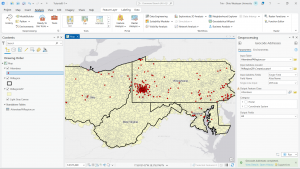
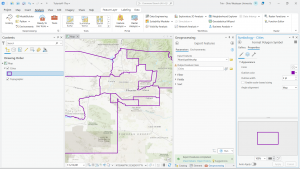
GIS Case Study:

1)


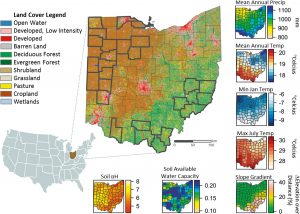
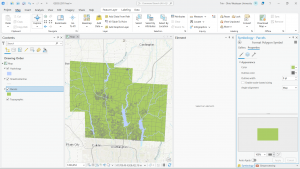
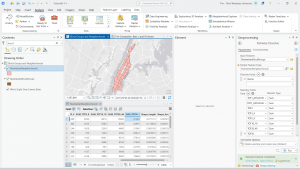
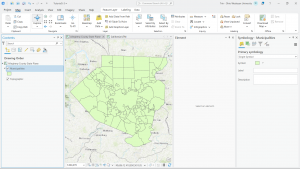
In this case study, GIS was used to map out the landscapes and forest changes in Ohio. This research was done to track the widespread disturbances and land changes due to the urbanization of highly populated areas, especially those initially settled in the 17th-18th century.  GIS and historical records were used to map out landscapes prior to colonization urbanization and track the changes over time up to modern day. The changes Deines saw included the switch and change of dominant species of areas along with the migration of species to new areas. The mix of urbanization, modern agriculture of Ohio, and introduction of invasive species has drastically changed the land the last few centuries.

Jillian M. Deines “Changes in Forest Composition in Ohio Between Euro-American Settlement and the Present,” The American Midland Naturalist 176(2), 247-271, (1 October 2016). https://doi.org/10.1674/0003-0031-176.2.247
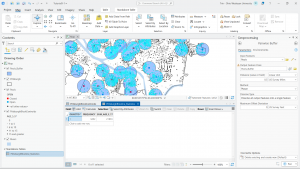
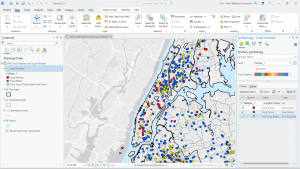
2)

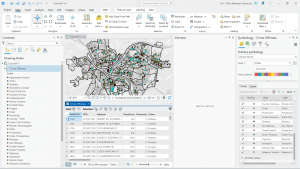
GIS can also be used to track the biodiversity and overlap of species populations. This would be important as urbanization drives populations to overlap and compete, or copulate, in more condensed areas. For example, mallard ducks and black ducks now overlap territories, although these species are behaviorally and genetically differing, they are close enough in relatedness to produce crossbred offspring called the mule duck. GIS can be used to track where these populations overlap and where these hybrid individuals are showing up to see if forced close quarters are causing this interbreeding.

Atlas, “GIS Use Cases- Biodiversity”, n.d. Biodiversity – GIS Use Cases | Atlas

Lavretsky P, Janzen T, McCracken KG. Identifying hybrids & the genomics of hybridization: Mallards & American black ducks of Eastern North America. Ecol Evol. 2019 Feb 27;9(6):3470-3490. doi: 10.1002/ece3.4981. PMID: 30962906; PMCID: PMC6434578. Identifying hybrids & the genomics of hybridization: Mallards & American black ducks of Eastern North America – PMC