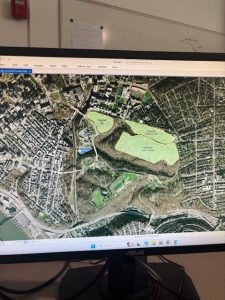
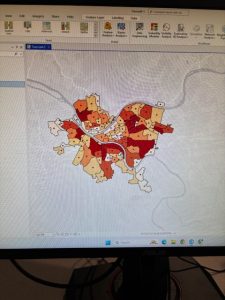
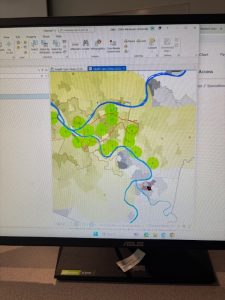
Chapter 1- This chapter introduced me to using ArcOnline, which was a different experience compared to what I had learned in Geog 291. At first, I was able to follow along easily, but as I got further into the chapter, I ran into challenges when working with data layers. One of the biggest issues was figuring out how to properly format my data so that it would display correctly on the map. I had to go back and double-check my work multiple times before it finally looked right.
Another part that I found difficult was understanding how to adjust the symbology settings to better represent the data. I wanted to make the map more visually clear, but I struggled to find the right colors and symbols that would best display the information. After experimenting with different options, I started to get the hang of it. I realized how important these small details are in making a map both informative and easy to read.
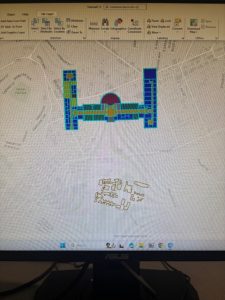
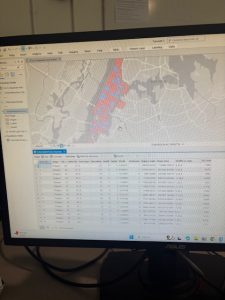
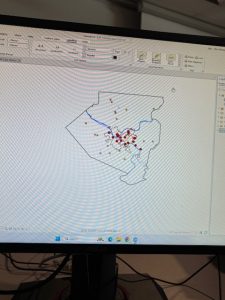
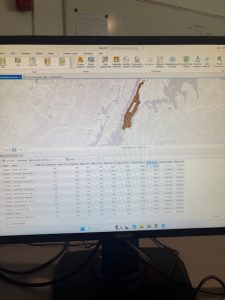
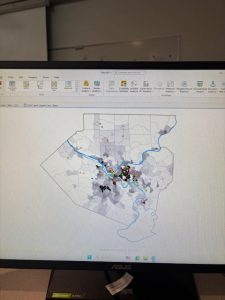
Chapter 2- Going into this chapter, I was feeling more confident, and overall, things went more smoothly. One of the first tasks was working with attribute tables, which I found really helpful in organizing and understanding the data. Being able to filter and sort information within the table made it much easier to see patterns in the dataset.
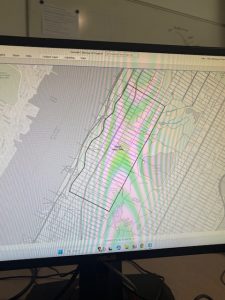
A challenge I faced in this chapter was trying to properly configure labels for the map. I wanted certain features to stand out, but some of the labels were either too small or overlapping in a way that made the map look cluttered. After adjusting the settings multiple times, I was finally able to make the labels clear and readable.
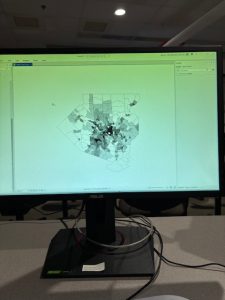
By the end of the chapter, I felt a lot more comfortable with these tools, and I started to see how all the different elements—layers, symbols, labels, and attribute tables—come together to create an effective map. I’m looking forward to applying what I learned to more complex projects in the future.