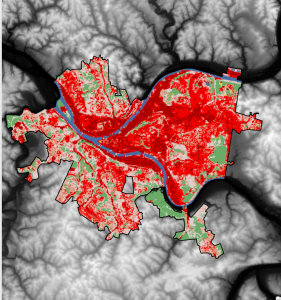
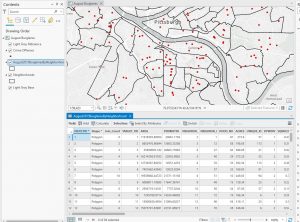
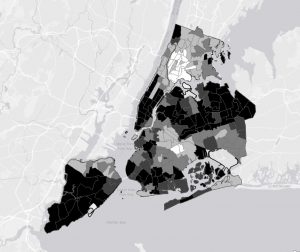
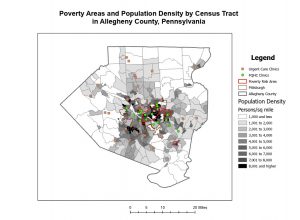
Chapters 9 and 10 went fairly smoothly for me. Definitely more complicated than the previous chapters, but I also found it to be very interesting and helpful. I ran into a few issues with the Chapter 11 tutorials, but if it took too long trying to figure things out, I would move on and it went pretty well. I liked that these chapters showed more intricate ways to represent and symbolize data. These are the kind of maps you see a lot, so it was cool to be able to make them myself and see how much I had improved with the intricacies and details of the software. Attached are screenshots of a few of my tutorials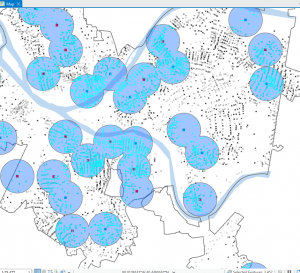
Author: jenorman
Norman Week 5
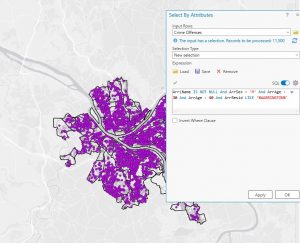
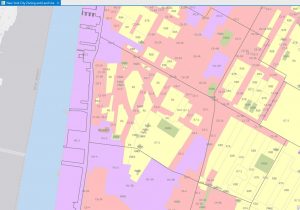
Chapter 4 was about file geodatabases and this went pretty smoothly for me with the attributes and such. I attached some screenshots of my work from this chapter. Chapter 5 was more difficult. I ran into some issues with the data I had downloaded because it was different than the book said and I couldn’t find the columns I was looking for to do some of the tutorials. I’m not sure what happened. But after reading the chapter and tutorials, I think that if my data was represented in the way it was in the book, I would have been able to do this easily, so I get the concept. Chapter 6 was mostly fine, I found it interesting. Chapter 7 was super fun actually I liked the polygons! Chapter 8 was also pretty smooth. No big issues to report. I have attached some work from the tutorials as well as my Delaware data in ArcGIS
.
Norman Week 4
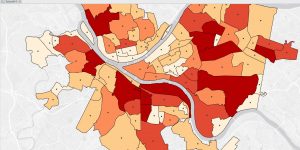
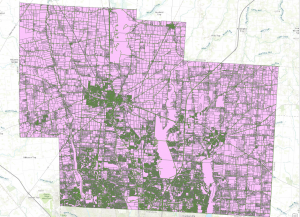
I did not have any crazy issues with the tutorials in Chapter 1. This was mostly just introducing to the software itself and finding basics of where things are. It seems really fun and fairly easy to use just from this introduction. I didn’t run into any issues with Chapter 2 either. I really liked chapter 2 with the map design aspects and showing different ways to display data to best symbolize the point you are trying to get across. I had a few more issues with chapter 3; it was not directly related to mapping, but more finding data and sharing the maps. I didn’t have problems with the charts, but sharing was a little tougher. Here are my maps from Tutorial 1-1, Tutorial 2-2, and Tutorial 2-6.
Norman Week 3
Chapter four discusses mapping density and how to show the highest concentration of features. This is useful for interpreting, identifying, and analyzing patterns. There are different ways to map density. These include shading defined areas based on density or creating a density surface. This method can be decided based on analyzing the data you have. The density of points or lines is usually done using a density surface method while you can also map data that has already been defined by defined areas. You also need to look at whether you are mapping features or feature values. This is an important distinction for analyzing. As far as the two methods go, you should map density by area if you have data that is already summarized by area or you have lines/points that can be summarized by area. This will produced a shaded fill map or a dot density map. A good thing about this method is that it is fairly easy to do, but it does not pinpoint the actual centers of density so it is not terribly precise in some situations. You should use the second method, creating a density surface, if you have individual locations, points or lines. This will produce a shaded density surface or contour map. This gives a more precise view, but is also more complicated involving more data processing. The chapter also describes in detail how to achieve both of these methods. Another concept it covers is the search radius. The size of the search radius matters because if it is larger the patterns are more generalized while if it is smaller it shows local variation.
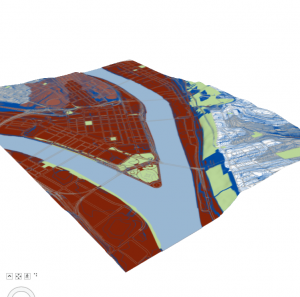
Chapter five covers mapping “what’s inside”. This is important because it allows you to monitor what’s occurring inside an area or to compare with other areas. There are different forms of data for this type of mapping. One is a single area. This can include things such as an administrative or natural boundaries, an area you draw manually, and the result of a model, etc. Another form of data is multiple areas. This can include contiguous such as zip codes, disjunct such as state parks, and nested such as floodplains. An important thing to look at is if the features are discrete or contiguous. Discrete features are unique and identifiable. They can be counted and quantified. Contiguous features are seamless geographic values. From the analysis, you need to discover if you need a list, count, or summary and if you need to see features that are inside or partially inside the area. The book lists three ways to find what’s inside. These include drawing areas and features, selecting the features inside the area, and overlaying the areas and features. Drawing areas is a good method to discover if features are inside or outside and its a fairly simple method, but is only visual. Selecting the features will give you a list or summary, so it is good to get information about a specific area, but does not tell you about things on the edge of a specific area. The overlaying method is good for both finding and displaying what is in different areas, but requires more data processing and is more complex.
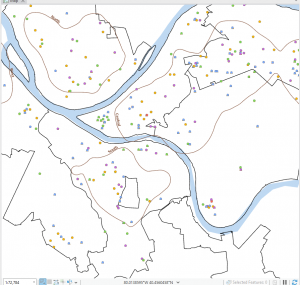
Chapter six talks about finding what is nearby. This is important because it allows you to look not only at features inside an area, but also what is outside and nearby an area. This can help provide context to an analysis which can help identify patterns. The first step is to define what constitutes both near and far. You can do this in many ways such as distance and cost. The information you need from the analysis is if you need a count, list, or summary and how many distance or cost ranges are necessary. There are three ways that you can find what is nearby. The first way is straight line distance. This is useful for creating boundaries and selecting features at a set distance away. The second way is distance or cost over a network. This is useful for finding what is within a set distance or cost. The third way is cost over a surface. This is useful for calculating overland travel costs. Which one to choose depends on what you are trying to accomplish and what data you have.
Norman Week 1
I’m Jenna and I’m a senior Economics/Politics and Government double major and an Environmental Studies minor. I am in Kappa Alpha Theta and on the OWU cheer team. Previously to reading this introduction, I had a vague understanding of GIS and what it does as well as its applications. However, this went very in depth and taught me a lot about the science of GIS itself. I generally thought of GIS as being more of a software rather than a discipline of science. The reading made this distinction and talked about the differences between the science and systems. It makes clear that you need to understand the reasoning and history behind the systems holistically in order to properly utilize and practice GIS. However, it discusses that GIS does not necessarily have one singular and comprehensive identity because it can mean many different things. I like this concept because it leaves room for growth and adaptability. I also enjoyed the discussion of the history because I thought of GIS as a solely modern development, but learning about its roots. The different applications of GIS are also very interesting because I understood how prolific it was, but didn’t realize that it touched so many different aspects of everyday life as well as different sectors of work.
I looked at GIS applications for economics and there are some obvious examples that I had studied before or talked about in class, but one concept I found new and interesting was its application in tourism economics. GIS is used to look at movement patterns of tourists to help plan infrastructure as well as marketing and can help look at the economic impacts on specific communities.
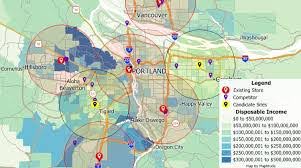
Another application I looked at was GIS applications in restaurants just because I work in a restaurant and thought it would be interesting to see how they can connect. One thing I found was site selection analysis which can allow businesses such as restaurants to look at traffic patterns and competition density among other factors to determine the best location for the restaurant\
.