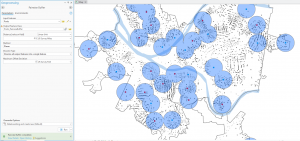
- Zip Code – Delaware County’s zip code layer was created by cleaning and reconciling 2000 Census data, USPS records, and county tax mailing addresses, then dissolving parcels by their property addresses in 2005. It is maintained collaboratively with the USPS, updated as needed, and published monthly.
- School District – Delaware County’s school district layer was created from the county auditor’s parcel records identifying district boundaries. It is maintained on an as‑needed basis and released as part of the county’s monthly data publications.
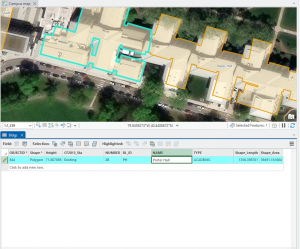
- Building Outline 2023 – Delaware County’s 2023 building outline dataset maps every building footprint in the county, derived from updated parcel and spatial records. It is maintained and refined as needed to reflect new construction, demolition, and accuracy improvements.
- 2021 Imagery (SID File) – this provides high-resolution aerial photography of Delaware County in 2021. It serves as a countywide visual base map used for mapping, verification of land features, and comparison against other years of imagery to track development and landscape change.
- PLSS – The PLSS dataset maps all Public Land Survey System polygons in both the U.S. Military and Virginia Military Survey Districts of Delaware County. It is updated whenever new surveys are recorded and published monthly to keep boundary information current.
- Township – This data set consists of 19 different townships that make up Delaware County, Ohio. This dataset is updated on an as-needed basis and is published monthly.
- 2024 Aerial Imagery – The 2024 aerial imagery provides a countywide set of high‑resolution photos of Delaware County captured in 2024, offering an up‑to‑date visual snapshot of land use and development. It is maintained as needed and published monthly as part of the county’s standard imagery updates.
- Delaware County E911 Data – the dataset contains the geographic information used for emergency response, including address points, road centerlines, and related location data needed for accurate 911 dispatching. It is updated as needed to reflect new development and ensure responders have the most current location information.
- Building Outline 2021 – maps all building footprints in Delaware County as they existed in 2021, based on county parcel and spatial records. It provides a snapshot of development at that time and is maintained as needed to keep the outlines accurate.
- Original Township – shows the historic township boundaries that Delaware County had before later changes. It is kept up to date as needed so these early boundary lines remain accurate for reference.
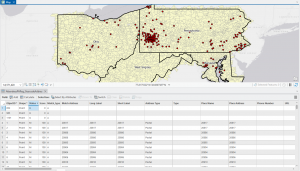
- Recorded Document – contains all official land‑related documents filed with Delaware County, such as deeds, surveys, and other property records. It is updated whenever new documents are submitted so the county’s land records stay current.
- Dedicated ROW – refers to road right‑of‑way areas that have been officially set aside for public roads in Delaware County. This dataset maps those dedicated road corridors and is kept up to date as changes or new dedications occur.
- Precincts – the voting areas that divide Delaware County into smaller sections for managing elections and assigning polling locations. This dataset maps those precinct boundaries and is updated as needed to reflect any official changes.
- Delaware County Contours – show the elevation lines across the county, illustrating hills, slopes, and terrain shape. This dataset helps with mapping, planning, and understanding how the land rises and falls.
- The Building Outlines – DXF – provides all building footprint shapes in Delaware County in a DXF file format for use in CAD and GIS software. It offers a clean, ready‑to‑use outline of every structure and is updated as needed to reflect new construction or changes.
- Address Points – DXF – contains all mapped address locations in Delaware County in a DXF format that can be used in CAD and GIS software. It provides precise point locations for homes, businesses, and other addressed sites, and is updated as needed to keep address information accurate.
- The Street Centerlines – DXF – shows all public roads in Delaware County as line features in a DXF format for use in CAD and GIS software. It provides an accurate map of the county’s road network and is updated as needed to reflect new or changed roads.
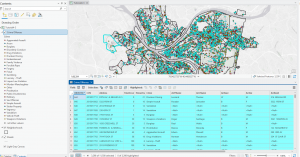
- The Parcels – It maps every property parcel in Delaware County, showing accurate boundary lines and ownership-related information. It is updated regularly to reflect new splits, combinations, and recorded changes in land records
- Street centerline – maps all public roads in Delaware County as single centerline paths, showing the official layout of the county’s road network. It is updated as needed to reflect new roads, realignments, or other changes.
- Condo – identifies condominium properties and their associated areas within Delaware County. It maps each condo unit as its own legal property, keeping the information current as new units are created or recorded.
- Subdivision – maps all officially recorded subdivisions in Delaware County, showing how larger parcels were split into lots and blocks. It is updated as new plats are filed so the county’s development patterns stay current.
- Tax District – shows the official tax boundaries used in Delaware County to determine which local authorities collect property taxes for each parcel. It is updated as needed so tax areas stay accurate when boundaries or jurisdictions change.
- Address Point – shows the exact mapped location of every assigned address in Delaware County, including homes, businesses, and other addressed sites. It is updated as needed to keep address information accurate for emergency response, mapping, and property records.
- Map Sheet – shows the grid of map sheet boundaries used by Delaware County to organize its official maps and GIS data. It provides a simple reference framework so users can locate features by sheet number.
- Farm Lot – shows the original agricultural lots that were surveyed and assigned when Delaware County was first laid out. These historic lot boundaries help trace early land division and are still used for reference in property research and mapping.
- Survey – It contains all officially recorded land surveys in Delaware County, including measured boundaries, bearings, and distances documented by licensed surveyors. It provides the legal, technical mapping of property lines and is updated whenever new surveys are filed or existing ones are corrected.
- 2022 Leaf‑On Imagery (SID File) – high‑resolution aerial photography of Delaware County taken during the growing season when trees have full leaves. It provides clear, detailed visuals for mapping, planning, and land analysis.
- Hydrology – Maps water related features like streams, rivers, ponds, lakes, and drainage systems. It shows how water moves across the landscape.
- GPS – This dataset identifes all GPS monuments that were established in 1991 and 1997. This dataset updated on an as-needed basis, and is published monthly.