Above is a PDF of my GIS final! Hooray!
Author: hjcox
Cox – Week 5
Here is a PDF with my work, comments, and issues for chapters 6-10.
Cox – Week 4
Getting to Know ArcGIS 1,2,3,4,5
Here is a PDF for the five chapters and exercises. Hope this was okay! It has a variety of notes, comments, struggles, and screenshots.
Cox – Week 3
Chapter 5: Finding What’s Inside
This chapter discusses why “finding what’s inside” lets you see whether an activity occurs inside an area or how to summarize the information to compare what is inside several areas. By monitoring and mapping what’s inside an area, it will inform people if action needs to be taken. An area boundary can be drawn on top of the features within a single area or several areas. Within these boundaries, there can be discrete features (unique and identifiable features) or continuous features (seamless geographic phenomena). There are also three ways of finding what’s inside by drawing areas and features(a map displaying the boundary area and features), selecting the features within the area (list of features in area), and overlaying the areas and features (patterns in features found in areas). GIS can be used to draw the area(s) on top of features to gain a sense of the discrete or continuous features within, as well as checking the location of each feature to see if it’s inside the area. A helpful tool to keep in mind is GIS can create a report of selected features through statistical summaries, creating a count (the number of features inside an area), and a frequency (the number of features within a given value). Overlaying areas and features lets you find discrete features and summarize them, calculate the amount of continuous categories or summarize continuous values.
A lot of this chapter felt repetitive and could have been condensed probably. I did however get a good understanding of mapping an area in order to find valuable information inside it. Most of the time, GIS is being used to target an area being studied so “finding what’s inside” seems like a way of saying “using GIS to find trends in the study area”.
Chapter 6: Finding What’s Nearby
Chapter 6 discusses how in finding out what’s nearby, you can see what’s within a set distance or range of a feature. The information you need to complete an analysis of what’s nearby involving a list, count, or summary. If you have more than one range that needs to be accounted for, inclusive rings or distinct bands can be used. In order to find out what’s nearby, you can measure either straight-line distance, measure distance or cost over network, or measure cost over surface. Straight-line distance can create a boundary/selecting features within a set distance from a source. This can be done by creating buffers to define a boundary to see what’s inside of it, or features can be selected to find other features within a given distance. Distance or cost over a network can be used for finding what is within a travel distance or cost of a location over a fixed network. For this approach, GIS can identify all of the lines in network (ex: streets, pipelines) within a given distance, time, or cost of a location. Cost over surface can be used to calculate what is nearby when traveling over land. When using this method, GIS creates a raster layer so the value of each cell is the total travel cost from the nearest source cell. In doing so, calculating the cost over a surface can show the rate of change and patterns.
I can see why it is important to find features nearby to help find patterns in the data that you are analyzing. I also appreciated how the chapter outlined clearly what each method should be used for and how, as well as the pros and cons of each.
Chapter 7: Mapping Change
Chapter 7 focuses on how GIS can help map changing conditions to an area over time since things are constantly changing. We map change to anticipate future conditions, decide on a course of action, or articulate the results of an action/policy. In order to map change, it’s important to understand the type of features and the type of change that can aid you in the process of mapping the change. Types of change outlined in the chapter included changes in geographic features, location, and character or magnitude. These involve discrete features that physically move or have gone through geographic phenomena. We can also measure the length of time between changes with three different patterns: a trend, before and after, and a cycle. Important to keep in mind when mapping change is instead of mapping the conditions over two different times, calculate a change in value as it highlights the features that have gone through the most or least changes. There are also three main ways of mapping change outlined in the chapter. First is through a time series for seeing changes in boundaries, values for discrete areas, or surfaces. The second way is through a tracking map which shows movement in discrete locations, linear features, or area boundaries. The last method is measuring change to see the amount, percentage, or rate of change in a place. After mapping change in an area, a time series can be created to show the change over time.
Overall, mapping change is used to calculate the difference in values over time and mapping the features based on the values. Land is constantly changing, naturally and by human interaction so mapping change is important as we analyze land in the past, present, and future.
Cox – Week 1
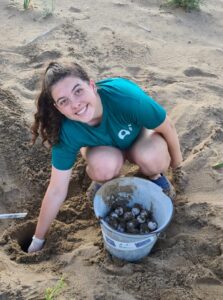
Hi everyone! My name is Hannah Cox and I am a Junior environmental science major and zoology minor here at OWU. I am from Orange County, California. Some of my hobbies include lacrosse, reading, and anything related to sea turtles!
Shuurman Ch.1 Thoughts:
When I initially began reading this chapter by Shuurman, it was clear that GIS is a multidimensional software with many different uses for many individuals. That is the beauty (and sometimes faults) of having a program like GIS because it can be used so broadly depending on what it is needed for.
I really appreciated the section discussing spatial analysis, separating it completely from mapping because of the large differences between them. Although spatial analysis and mapping can intersect, spatial analysis generates more knowledge than what can be interpreted from maps or data. The author made it clear that when having GIS, you must understand how to frame questions to implement a successful quantitative model and if it is sufficient in the context of the available data.
I was intrigued by the terms GISystems and GIScience. GISystems contain components like data input, analysis, mapping, etc., whereas GIScience is simply a theory that underlies GISystems. Having each GIS followed by systems or science represented the interrelatedness as well as how fuzzy the distinction can be between them.
I enjoyed reading the last section of the chapter discussing the various ways GIS has been used. It is really amazing how GIS can be used to help various businesses, municipalities, and cities/urban areas. GIS is a fantastic example of how the digital world can help organize and fix real-world problems.
Google/Google Scholar GIS Application:
I sought out how GIS can be helpful in sea turtle conservation.
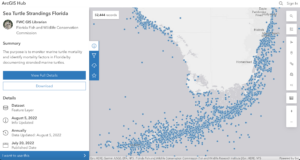
In my search, I found that the Florida Fish and Wildlife Conservation Commission monitoring marine turtle mortality and identifying the mortality factors in Florida since 1980. Between 1980 and 2022, there had been 53,444 strandings consisting of turtles found alive, injured, or deceased. Data was taken around all of Florida with the image showing the bottom south of Florida. GIS can also be used to visually represent nesting data during nesting season along a known nesting beach.
Sources:
https://sjcfl.maps.arcgis.com/apps/Viewer/index.html?appid=1d8d52ed9d5744659daacc32912c3eb1