Kopelcheck Week 6

Chapter 9:Ā Chapter nine was a chapter I found to be relatively easy ring buffers were a cool thing to learn and again relatively easy to figure out. This time around my outputs all worked and I experienced no issues with this. I also liked the ability to add the names of the pools onto the map I liked the look of this (Images are submitted below).

Chapter 10:Ā Chapter ten was one of the harder chapters for me, although I was able to work through it, the code was a bit complicated. I did not realize that you had to double click the symbols and data to input them into the code. However once I figured this out it was relatively easy to type. Just a hefty amount of typing and enaming and selecting properties (Images are submitted below).

Chapter 11:Ā Chapter eleven was also relatively easy. I liked how we were shown more ways to add images like trees in the model. I also like being able to use 3D buildings and features. Overall this chapter fulfilled my creative side and was one of my favorites (Images are submitted below).

Here is the definition sheet for the Data Inventory as well as the map:

GIS Summaries

Kopelcheck Week 5

For each chapter I have thoughts and things I thought were interesting. Firsty for chapter 4 I will not lie when I say this was probably the most difficult chapter for me as I had a hard time navigating through the outside databases and figuring out the downloading system. Once I was able to figure it out I will say this seems very useful when applying this to a plethora of data sets. Chapter five I also struggled with importing data however I again did figure it out although I did have a hard time putting in outputs as it kept given me errors and not allowing me to run the program. For chapter 6 I like how I was able to see and click through points/streets to find more information. This chapter I had a hard time with the outputs but I eventually figured it out and I will not lie I felt extremely satisfied with myself. Chapter 7 I like the ability to use shapes and using tools that allowed me to draw my own shape. I will admit I forgot where the transparent function was so I decided to go with the hatching setting to still give that. Finally chapter 8 was interesting as it had a lot to do with zip codes as well as creating bookmarks (in a way). Overall I really enjoyed chapter 7 as it gave some fun creative aspect to GIS. I seemed to struggle the most with output inputting, I kept running into an error wall and I could not find out why. I also seemed to struggle with finding the output variables, as they did not seem to pop up. Regardless I was able to achieve results, something I will have to look in to/practice more is the output data set.

Below I have attached pictures of my work through various stages of chapters 4,5,6,7, and 8.


Week 4 Kopelcheck

This was the first time I have used ArcGIS and it was very easy for me to navigate. I found the tutorials extremely useful and easy to follow. There were some points where I did skip as I could not locate what they were asking of me, so that will most likely have to be something I look back on incase it is useful for future assignments. Overall I had fun exploring ArcGIS and seeing the cool features it has. My favorite is the 3d models they look really cool and I like also how you are able to explore with your mouse. Below I have attached some photos I took from each chapter (1,2 and 3).

Kopelcheck Week 3

Chapter 4

When reading chapter four I learned many new terms and found many things interesting. Firstly starting mapping density is very interesting, I like how it is well explained how this differs from other maps and that it can be more efficient than when blocking concentration of areas. Along the sames lines as this density surface being created by GIS is also cool to see and be explained in this book. I would have never thought the calculation process would be a complex as it is, the images shown to depict this are also very interesting. Also the significance of cell size is something I never considered to be a detrimental factor to GIS. The word Quantile is something new that I learned which essentially means that each class has the same number of cells in it. Contour lines are also something I found very interesting especially since when I have seen them before it is typically associated with the documentation of hills and ground patterns. To see it here being used in GIS not just for land but in terms of value and change like for example used with mapping local businesses. I also find it interesting how much data impacts the map we see more data points equals an increase in density which creates a more cohesive and readable map, while only a few points can cause a more empty map and leave it harder to read. Overall chapter four gave more clarity and purpose for density mapping and how this can be more efficient as well as holds important.

Chapter 5

When starting chapter five there were again many things I learned as well as found interesting. Starting with the difference between single area mapping versus multiple area mapping. Firstly this is something I knew coming into this chapter the difference being that single areas focus on just a single plot point data set area. While multiple areas plot multiple sets of data and points in a given area that then compares these data sets. I can see how both would be desirable as data sets, however I find that seeing inside multiple areas can be really useful. I also feel like discrete and continuous has been something discussed in earlier chapters, the same seems to apply to these features when applying it to finding what’s on the inside. I also found the linear features can lie outside of features as well as inside. When looking at the map example images given this looks very interesting I also found how mappers utilize this feature as an example of wanting to include parcels within a 300 foot buffer, the usage of this method seems to prove useful. Finding what’s inside is explained very thoroughly and as such is an easy concept to grasp. I also appreciate the table with the comparison and the good features and trade-offs for each method is very nice. It’s also very nice how you are able to select certain feature within an inside area. I honestly did not really concept what GIS is capable of, however it does really remind me of the coding site R studio, in that they both are very capable of doing a lot that allows for data to correctly be read. It also seems like the software we are going to be using within this class ArcGIS has some handy tools to make utilizing results easier. Overall this chapter seemed to explain a how to use GIS with the contents of finding what’s inside, it seemed a lot of the methods and concepts seemed to apply to earlier chaptersĀ  and thus I feel as though I was able to grasp these terminologies more.

Chapter 6

Finally when starting chapter six I again learned many new things as well as found other things very interesting. I will first start with the concept of chapter six, being finding what is nearby, this being able to find and monitor events within a given respected area is a concept I again never thought GIS would be able to do. I will say that one thing I have found when reading this book is that I am constantly finding out all that GIS can do and it is typically more than what I believe it can do. Steering back my interests and learning ot chapter six, I did not know to find what is nearby in GIS you need to consider the measuring of either distance or cost, specifically cost being the measurement of time. This is something I again would have never thought GIS could do.Ā  I also like the incorporation of different mapping types that can be utilized to find this data and theĀ  three differing ways of finding what is nearby. Again the chart used to show the differences and the pros and cons of each of these methods makes forĀ  linear and cohesive learning experience for me as the reader. When looking at the types of maps that can be made for finding what is nearby (excluding the continuous maps) I find similarities to these and the graphs you can produce with R studio. Overall this chapter was a longer one that seemed to explain yet another new method of mapping just as the previous chapter (chapter five) did. With this being established I found it helpful how all measures were explained and shown with examples.

Kopelcheck Week 2

Chapter 1:

When reading this chapter there was many things that interested me as well as new concepts that stuck out ot me. Firstly starting out with the first few pages of the first chapter I was not surprised to find the meaning of GIS to be geographic mapping of many different things. We specifically covered many of the things GIS can do with the previous weeks reading, so this information was expected and not new to me. Next the term continuous phenomena was something I have never heard in regards to mapping temperature and regarded as blanketing a map with no gaps. There are many other mapping methods too that I did not know completely like the raster model and vector model (I do realize that these are the main two representations of geographic features). It was interesting to see the comparison of these methods side by side with the same mapping set. I do wonder why one is more preferable to certain subjects over the other? There was also many vocabulary when put into the GIS context like categories’, map projections and coordinates. However I did find ranks to be interesting, organizing and placing data relative to values, at least in terms of GIS I never thought this would be something that would be useful. The ratio section of this chapter reminded me of when we map data using specific plot data in R-studio. The layout as well as the key guide prove similar to this comparison. Lastly data tables being so significant to the GIS process, yes I know that data itself is extremely important, as these maps are made based on the data provided however I though the map created would prove to be more useful than the data table. Chapter one was a good overview of the systeming expected to come along with GIS mapping.

Chapter 2:

Reading chapter two with the knowledge gathered from chapter one, I had many more thoughts along with more answers to GIS as a whole. Firstly I found it interesting that GIS mapping can be used for businesses to pin point customers by age or other traits to help classify their clients and utilize this information to create a better sales or business strategy. When it comes to preparing the data I find similarities again with GIS to R studio, the type of data prep and coding as well as the categorizing of certain data points all read within the same lines as R studio code and category. This similarity can explain why some maps look similar to some data graphs I have seen within R studio. I do wonder if mapping just a single type data set or features is more beneficial than the latter? Could more data features help widen an answer or set of data? I also find it very interesting that the most categories you can map is seven due to the intake people can handle. What I mean by this is that people can only distinguish between a certain amount of colors or symbols, thus going over this threshold makes the maps too complex. I guess this answered my question in some ways as there is a sense of too much data that is portrayed within GIS. Now with this being said mapping over seven can be done but must be done so with grouping, so simply seven categories alone is almost more substantial than the latter. I also thought it was interesting that choosing your symbols can help reveal patterns within the data and these symbols can be read as their own data on a map. I would never think symbols would be that important, however it would make sense as GIS proves that grouping factors pave the way for an ideal map. It’s good to know that mapping a correct GIS map can prove to show patterns, some that you were not expecting. Chapter two broadened what I know about GIS maps even more and proved essential in learning the value of mapping and the patterns presented from such.

Chapter 3:

Finally when reading the final assigned chapter of this week I had more thoughts and things I learned andĀ  found interesting through this chapter. Firstly I’m noticing a lot of vocabulary from chapter one and two being pieced together to explain why someone chooses to make GIS maps one way over the other. I also like how Mitchell reminds us to have a purpose to the map, whether we want to explore the data set created or have something precise and cohesive. This connects to having a purpose when creating a GIS map. I also find it interesting the way that finding and choosing the quantities you want to utilize create a framework for the map, again I would’ve supposed data points would have a bigger makeup of a GIS map, but it seems that quantities are equally important. One thing I learned is the meaning of class is the groups of similar features assigning them together typically with a symbol. Another thing I learned is all the types of classification schemes, it’s interesting to see how each one can be useful depending on what you are looking to create, it’s also interesting that disadvantages for each are included, this allows the map creator to have full control over how they present their data. Chapter three was very informative when it came to how to create trends and maps and what data would be more beneficial to use and utilize, I learned more definitions and things I did not know applied to GIS.

Kopelcheck Week 1

Hi! My name is Grace Kopelcheck and I am currently a senior majoring in zoology! I currently work at the Columbus Zoo and Aquarium as a seasonal zookeeper in theĀ  Animal Encounters region (right next to the sea lions!). I have also volunteered at the Ohio Wildlife Center for a little over a year, as well as have interned in the Asia Quest region for a semester! Currently this semester I am interning at Cosi with their animal care team!

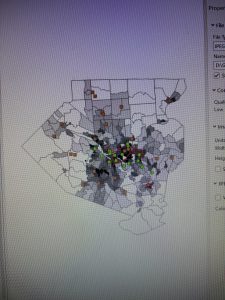
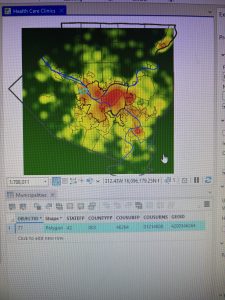
When reflecting on the reading I had many comments and thoughts throughout the reading. Firstly when reading the first page I was shocked to learn that GIS can rationalize organ donations. I always thought that GIS was used for more land mapping, but I did not realize the full extent of the content GIS can create/explore. I also never realized the social implications of GIS and what it can do to expand on things other than land. Itā€™s also interesting to read that GIS is considered to have an identity crisis. I think this is funny as well as interesting as I even thought of a different identity for GIS than what it has been used for. I also find it interesting how much we have utilized GIS even though it was stated in this paper that it was a newer technology. This use of newer technology becoming an upcoming feature for many companies and usage reminds me of AI and how this a new very utilized technology as well. It was also interesting to read how one challenge GIS faces is being able to draw strict boundaries represented with lines drawn from GIS. Overall this reading was interesting and gave me a better understanding of the capabilities that GIS has and can do.

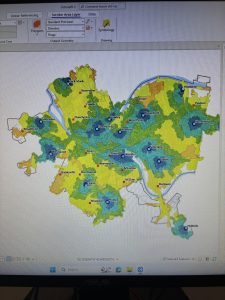
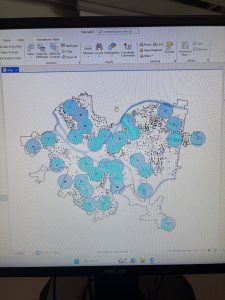
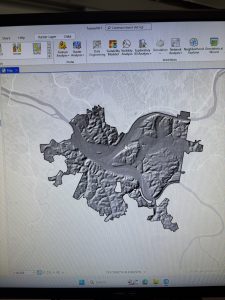
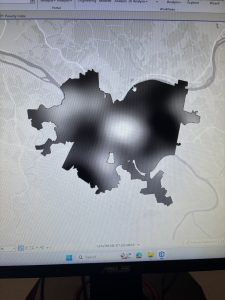
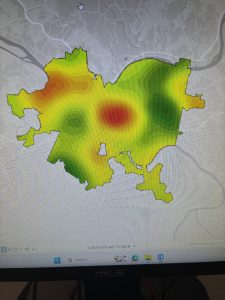
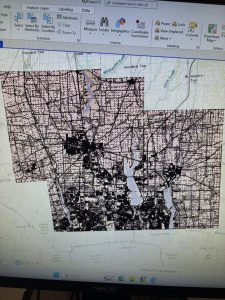
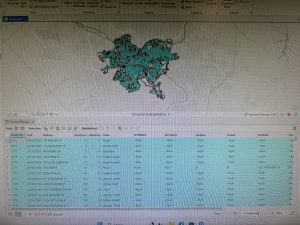
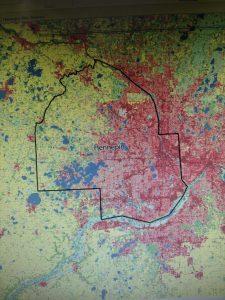
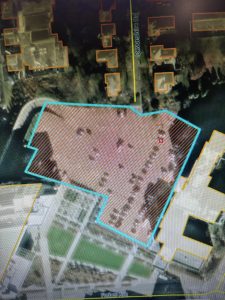
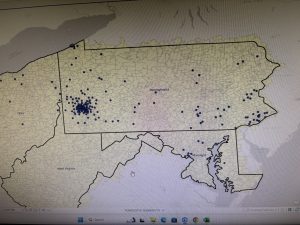
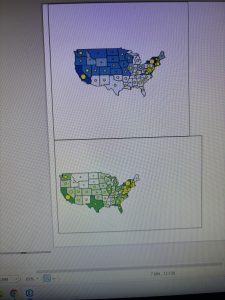
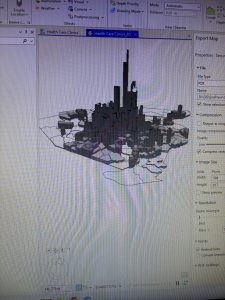
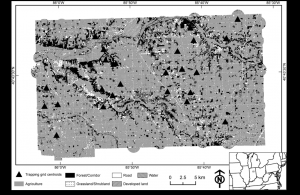
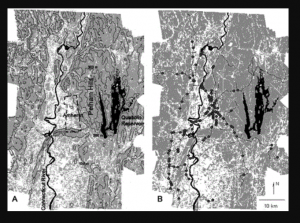
For looking into sources of GIS applicable/interesting to me, I used the key subject of Virginia Opossum (as they are my favorite animal) to find GIS application. I found two interesting articles talking about the population distribution of Virginia Opossum and how they move towards human populations due to food (Beatty et al. 2016). Another article tracked the same information however with road kill found and the findings of human influence land types and the amount of roadkill found had negative correlations (Kanda et al. 2006). GIS proves useful in tracking local populations of animals! Below are some GIS maps from both these articles that show the land that Virginia Opossum were found to inhabit (both dead and alive).


Beatty, W. S., Beasley, J. C., Olson, Z. H., & Rhodes Jr, O. E. (2016). Influence of habitat attributes on density of Virginia opossums (Didelphis virginiana) in agricultural ecosystems. Canadian Journal of Zoology, 94(6), 411-419.

Kanda, L. L., Fuller, T. K., & Sievert, P. R. (2006). Landscape associations of road-killed Virginia opossums (Didelphis virginiana) in central Massachusetts. The American Midland Naturalist, 156(1), 128-134.