Chapter 4
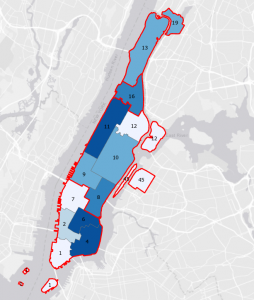
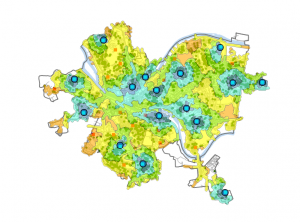
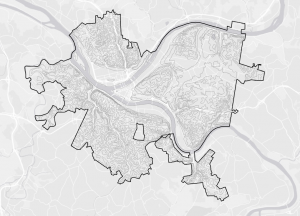
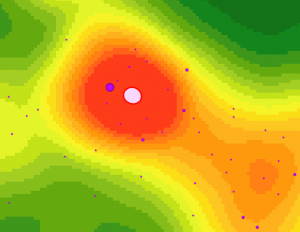
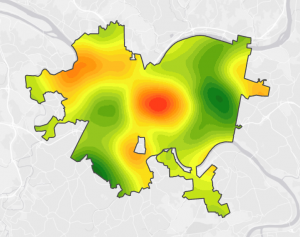
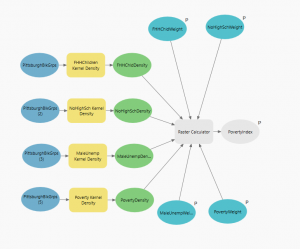
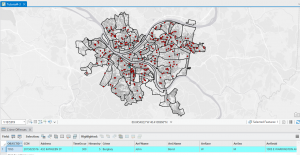
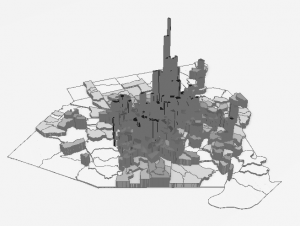
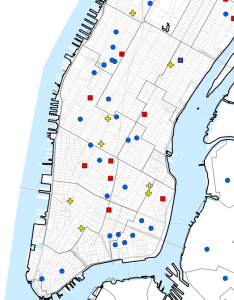
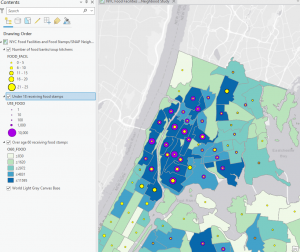
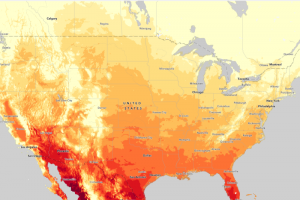
Mapping density shows you where the highest concentration of features is, useful for looking at patterns and mapping areas of different sizes more than it is for the location of individual features. A density map using areal units like hectares or miles makes it easier to see higher concentrations of features than by simply mapping the individual points. When making a density map you can map points or lines as a density surface, or you can map information already summarized by defined areas like counties. There’s a difference between mapping features (locations of businesses) or feature values (the number of employees at each business) which can create drastically different patterns and have different use cases. You can map density either by a defined area or by density surface. Dot maps are a defined area density map that collects a specified number of features represented as a single dot. The concentration of thee points will represent density graphically rather than density value. Dot maps provide a quicker sense of density to the reader, as the dots are easier to read. When calculating a density value for defined areas you do so based on the areal extent of each polygon, dividing the total population of features within that area by the areal value. This is usually displayed as a shaded map. Calculating by density surface is usually done through a GIS raster layer, which uses the features found within a cell to define its density value. The cell searches for features within a defined radius around it and assigns itself a value before the GIS repeats this in the next cell, this creates a running average of features per area and results in a smoothed surface.
Chapter 5
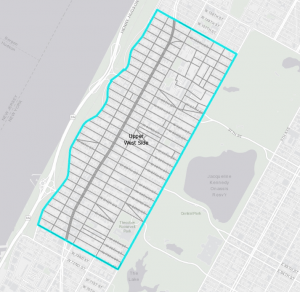
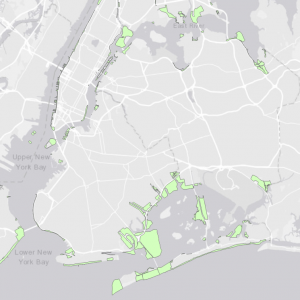
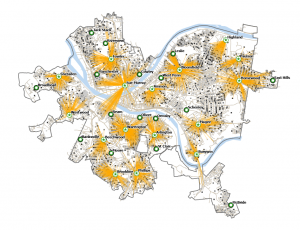
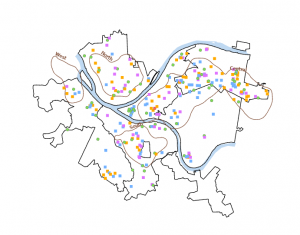
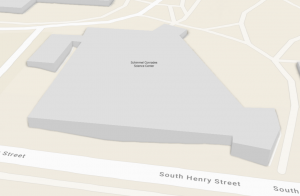
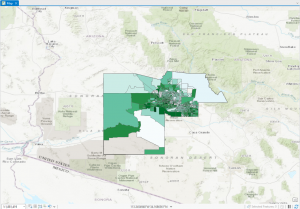
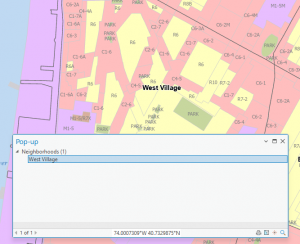
People map what’s inside an area to monitor what’s occurring inside it or to compare several areas. This helps people know whether to take action (if drug arrests occur within proximity to a school there’s harsher punishment) and it lets people compare what areas have more or less of certain features (conservation organization targeting areas with the most old growth forest). To find what’s inside you can draw area boundaries over the features, letting you selected and summarize the features contained within. Single area mapping lets you look at service areas around a central facility, or buffer that define a protected distance around certain features, administrative or natural boundaries, manually drawn areas, or the resulting boundaries drawn by a model. You can also find what’s inside several areas you’re treating as one (contiguous like zip codes, disjunct like state parks, or nested like 50- and 100-year floodplains).
Chapter 6
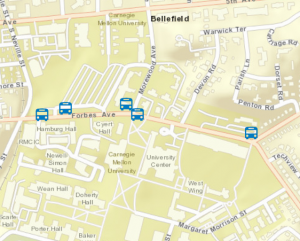
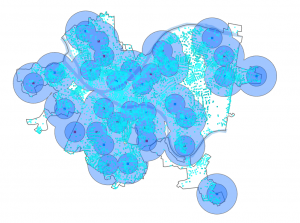
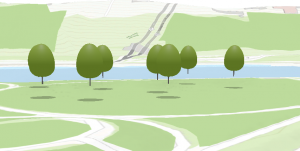
You can use GIS to find out what’s happening within a set distance of a feature, and what’s in traveling range. Finding out within a set distance identifies the area, and the features inside it, that will be affected by an event or activity. This could be a city planner needing to notify all residents within 500 feet of a proposed liquor store, or inclement disastrous weather like flooding. Finding within a set distance also lets you monitor activity within it like preventing logging within stream buffers. Traveling range is measured using distance, time, or cost. Finding traveling range can help design the area served by facilities like fire stations or stores. You can measure straight-line distance, measure distance or cost over a network, or measure cost over a surface. Though it may not immediately seem like it time is a measure of cost. Sometimes it will matter whether you are measuring over a flat plane or over the curvature of the earth. If your area of interest is small like a city, a county, or a state it would be easier to use a flat plane because the curvature does not affect measurements that severely. For larger areas of interest, you’ll need to account for the curvature of the earth.