Henderson week 5

Chapter 4: Tutorial 4-1 was about exporting features and I found it all to be fairly straight forward.  We also used a lot of the data from the gdb, which was cool to learn how to do. The second tutorial was about attribute tables. I learned how to delete columns, add fields using the fields view tool, and joining/combining data and how to calculate the sum of fields. This tutorial was easy and I had no problems with it. 4-3 was about queries and I struggled with it at first. It kept telling me that my queries weren’t valid but I moved on and came back to it and had no problem. It showed me how to do a number of different things with queries and I ended up using them in the following chapters. 4-4 was about spatial joins and was quick and easy. The fifth tutorial taught me how to use the Feature to Point tool to teach me how to create a point layer. This tutorial was also easy. 4-6 was helpful because it had two different “your turn” sections which allowed to test what I had learned. Overall chapter 4 was easy and helped with what I did in the next 4 chapters.

Chapter 5: 5-1 was about correcting distortions on world maps. Because it is such a large space, and because the earth obviously isn’t flat, distortions are created on maps. I was able to learn how to help eliminate those in the first tutorial which was helpful. 5-2 was short and easy as it only covered one thing. I learned how to set a projected coordinate system, which helped me with the next tutorial. The third tutorial was also about coordinate systems but it showed me how to add layers, change coordinate systems and change the projected system. 5-4 taught me how to use multiple different tools in GIS. I learned more about exporting features, creating new layers from data, and adding X,Y coordinates. This tutorial was very helpful because I continued to use the export features tool throughout the tutorials. The fifth tutorial had me download data from another website to implement into a map. This is definitely something I will need to use again in the future so I’m glad I learned it now. I also learned how to sort through data and join data together to a table. The last tutorial for this chapter was one that I had trouble with. I was able to extract by mask and add the new data but I was unable to download data from the public agency website because the layer it told me to download was no longer an option. Other than that this chapter went fairly smoothly and was very educational.

Chapter 6: Chapter 6 overall was the easiest chapter for me. I blew through it and had no issues. 6-1 was about dissolving fields in the attribute table and block groups. I felt very confident in this section because when I got to the “your turn” portion I was able to do what it said without looking back at the steps. 6-2 was about selecting and editing different layers. First I learned how to select by attribute and then by layer. I was also able to do this section easily without the steps. 6-3 was really short as it only went over one thing. It taught me how to merge feature classes into one. I did this with water and waterfront parks in NYC. 6-4 showed me how to append two different classes to an already existing larger class. This was similar to joing information except I added two to one larger one. 6-5 taught me how to use the Pairwise Intersect tool. This tool is helpful for putting data on streets/centerlines.  The summarize feature allowed me to create a new attribute table with summarized length. 6-6 started with the Union tool which created new layers with smaller polygons with popups. This is good for neighborhoods. Then i used the Calculate Geometry tool and made a new definition query. I also did different things with the attribute table which was helpful for the next two chapters. The last tutorial had me zoom to different fire companies to study the polygons and different information on each. The last thing I did was learn to use the Tabulate Intersection tool which helped sort information on the attribute table.  For the “your turn” section I used the summary statistic tool to find out the total number of disabled people which can be used for planning.

Chapter 7: 7-1 was all about using the move button. I moved buildings to line up with the basemap. For the second tutorial I continued to use the move tool but I also learned how to split and relabel things as well as trace the outline of something. 7-3 taught me how to make the harsh lines rounded for things like parks and bodies of water. The last section of chapter 7 was slightly more complicated. I added data to create a new layer and then moved it to a different section of the map. I couldn’t figure out how to turn on the different layers at first as there wasn’t a check mark next to them. Then I exported the features to a new feature class and deleted the original. That is when I rotated the building and moved it closer to the other parts of the map so that it wasn’t as large compared to in the photos.

Chapter 8: This chapter was very short, and I had no problems with it. 8-1 was about zip codes. I made geocode data by zipcode first and then rematched data by zipcode. I learned how to use new tools in this section which was interesting. The second tutorial taught me how to use the create locator tool and then match data. I also used the geocode addresses tool again and learned how to select minimum candidates and create matching scores.

Henderson week 4

Chapter 1:  The first chapter was all about showing me the ropes on the different settings of ArcGIS. I learned how to nagviate the ribbon and the contents plane which made everything else I had to find much easier.  I liked the each tutorial focused on one aspect of a map, and went in depth on not only how to create things, but also how to find new things and go back and change mistakes. I also liked that throughout chapter  1 the map stayed the same, I just worked on different parts of it. I found that ArcGIS was very easy to navigate, especially with the tutorial book because it was very easy to understand. At first I found it a little tenuous but then I realized that having me do the same steps so many times made everything easier in the long run because it became muscle memory. I really liked the section of each tutorial called “your turn” because it allowed me to see what I remembered and what I still needed more help with. Overall, chapter 1 was a good introduction to ArcGIS and gave me the necessary tools I needed to be able to move on to the next two chapters.

Pic.pdf

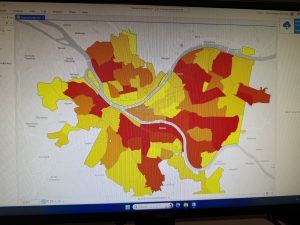
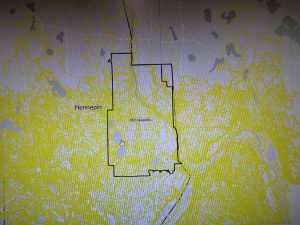
Chapter 2: This chapter used the information I was taught previously and built off of it to explain new ideas and concepts. Most of what I learned in this chapter was about symbology. I picked colors and symbols, as well as labels and pop ups. I was unable to edit the symbology for “over age 60 using food stamps” despite my efforts to restart the computer, and troubleshoot. From looking at my peer’s posts, it seems I was not the only one who had this problem. I also couldn’t find a button called “out beyond” but I was able to still achieve making my popups appear and disappear through the visibility range> max/min> <current>. In the tutorials in this chapter I was able to learn how to separate my data by different categories and figure out how to label things differently based on what I wanted the readers to learn from my map. I also learned how to create a dot density map, and how to change the features so it looks the way you want. This chapter had a lot of information, but each tutorial took information from the last, which made it flow nicely and easy to understand.

PDF pic chap 2

Chapter 3: This chapter is the one I found the most interesting. I liked being able to go from my maps I had created to making a blog and importing data to a website. Seeing everything I had done so far come together was really cool. The first tutorial was long and had a lot of content to cover but it was also very helpful. Learning how to compare two maps was very helpful, as well as comparing thee data in both of them to see the relationship between them. This chapter caused me more problems than the others. I felt that I wasn’t always sure I was doing the right thing but being able to use the pictures in the book to compare was very helpful. I felt that creating and editing a dashboard was the most helpful thing I learned in this chapter because it allowed me to interact with real data, as well as upload and change things. Sharing my map and my blog was a cool first step into seeing how much can actually be learned through GIS. THis chapter gave me insight into how GIS is used in the real world and all of its different programs and uses.

IMG_5480


Henderson Week 3

Chapter 4 is all about mapping density. It discusses why it is important, the different ways to map density, how to map density for specific areas, and how to decide what to map. The definition of mapping density is where the highest concentration of features is. One thing that was very helpful was when the book explained that you should look at your features and the information needed to complete the map before making a decision on what kind of map to create. Density maps are also more helpful for comparing areas. There are two ways you can map density. The first is by defined the area using a dot map. Dot maps are beneficial for representing the density of individual things in large areas. The other use of dot maps is when you have many features in one space and don’t want to map all of them individually. The second way to map density is through density surface. This is created as a raster layer as opposed to a vector. It is more detailed than a dot map but requires more time and effort. The book goes on to lay out the comparisons and explain how to decide which mapping method to use. Then, it explains what GIS does and how that applies to mapping density, which I found very helpful. There are multiple factors that affect a density map, including cell size, which determines how “fine or coarse” the patterns will be; search radius, which determines how generalized the area the map is showing will be; calculation method, which will determine how clear/easy it is to interpret the map, and units which help make sure the map is accurate.  Something I had not considered important was the colors used on the map. It was interesting to read that while “more” on most maps is darker, the contrast of making “more” lighter colors can help grab the reader’s attention.

Chapter 5, titled “Finding What’s Inside,” is all about why it is important to map inside an area. The first examples the book gives are about whether or not one should take action based on the map’s findings. There are numerous questions to answer when analyzing your data before mapping. The first is how many areas you are planning to map, which can be determined by what it is that you are mapping. The second question is whether or not the features inside are discrete, meaning they are identifiable or continuous, which are seamless geographic features. There is also important information you must get when analyzing your data. You must determine how you get your information (count, list, or summary) and also determine whether to include features partially inside of the area. The book then highlights the three ways to determine what is inside an area. You can draw what’s inside the area, select the features inside the areas, and overlay the features and areas. The first is best for seeing if one particular feature is in an area. Selecting the features is best for getting lists or summaries, and overlaying is best for finding how much of something is in an area or seeing if something is in more than one area. One important thing this chapter highlights is how to make this kind of map easy to read. It talks about lines, locations, and discrete and continuous features. You can use the results from the map to make lists, and show statistics of features in that area. Overlaying areas is a useful tool to help find features and summarize them. Throughout the chapter, it highlights what GIS does in each feature and method listed which was helpful for me because it allowed me to understand the different uses of GIS better.

Chapter 6 is about finding something that is near a feature you are mapping. This is useful for finding out what is in an area’s traveling range or finding the specific distance between two features.  Similar to when finding what’s inside an area, you need to first define your analysis. A lot of the steps when finding things nearby are similar to the steps needed to find what’s inside. You should ask yourself many of the same questions and collect the same data. There are three ways to find what is nearby: straight line distance, where you identify the source and distance and then GIS finds everything surrounding it; distance over a network, which is when you explain the source and distance; and GIS finds things that meet those parameters, and cost over a surface which is when you declare what each source feature is and a cost and GIS creates a new layer on the map with each features cost. Another similarity between chapters five and six is that they both compare each method and explain when it is best to use each one. A term that comes up a lot in this chapter is buffer. A buffer is a zone a certain distance from the designated area in every direction. Buffers are important because yu can specify multiple sources and see the distance from each one of them and how they overlap.  There are different ways you can set up a map once you have a buffer depending on what you want the readers to understand from it. Instead of a buffer you can also select features at “x” distance. This is similar to a buffer but without the physical boundary/circle shown on the map. Another option when finding things nearby is “feature to feature” which will show you the distance between two features. The last option the book discusses in this chapter is creating a distance surface. This means creating a raster layer of all of the continuous distances.


Henderson Week 2

Chapter 1:  Chapter 1 was meant to explain the basics of GIS, mapping, and spatial analysis. I know very little about GIS, so I found this chapter to be extremely helpful in clarifying what it is meant for and how it can be used in my field. I did not realize how many different things you could map and that there were multiple different methods of mapping something using GIS. I found learning about the different features, “discrete,” “summarized by area,” and “continuous phenomena,” to be the most interesting because each of them is unique and has its own methods and distinct uses. The chapter then dives into the two methods of representing geographic features. The first is vector models, where each feature is put in a table using x and y coordinates. Vectors have harsher lines, and each area is defined by a border. On the other hand, rasters are defined by their cells. There are no harsh lines, and they are often layered. I found the example maps showing the difference between vectors and rasters the most beneficial part of this chapter. Seeing a side by side comparison helped me understand when it is best to use what and emphasized the differences between them. One thing I had not considered or realized would be a problem is trying to map large areas. Due to Earth being spherical, large mapping systems can become distorted, and misshapen. This was interesting to read about and I will definitely keep it in mind when mapping throughout the semester. One of the last things chapter one talked about was attribute values. The book gave examples of each value, when they are used, what they are best used for, and what mapping them should look like. Lastly, the chapter starts to explain how to work with data tables in the GIS system.

Chapter 2: Chapter 2 starts by asking why it is important to map where things are. It explains that mapping individual features can be useful, but mapping an entire area is important for learning more information about the area as a whole. They gave the example of mapping an entire area based on crime rates so that police know which areas need the most attention. I found this interesting because I had not considered that police and other law enforcement jobs would use GIS to help them. The purpose of this entire chapter was to answer common questions about mapping and help clarify when it is best to use different parts of the GIS system. Something I noticed while reading was that most of the problems that arise when using GIS come from human error rather than problems with programming. I am glad that this is something that is acknowledged because it helped me understand how important it is to take your time when inputting data, assigning values, assigning coordinates, and so on. I was also impressed by how many different things you can do with GIS and the fact that you can layer things so that one map provides multiple types of information. Reading about how regrouping the same data in different ways was not only interesting but also a testament to how many things you can do with GIS. Something I am still struggling with is what the codes mean for information. I feel that I am still confused about some of the technicalities that come with mapping. Overall, I found this chapter extremely helpful because it provided a lot of information and went more in-depth with different features you can utilize while mapping.

Chapter 3: The last chapter this week starts by examining a more narrow topic than the two previous chapters. It focused on mapping the most and least of something. It is most useful to map the most and least to understand relationships between places, and see if a specific place meets your specific criteria. Through all three chapters this week I found the example maps to be the most useful to me. Reading about mapping is helpful but being provided a visual helped me understand the content significantly better. Mapping quantities was a term that I found very important. Quantities are the amounts or numerical values you need to be able to map something correctly. The next important topic in Chapter 3 was classes. Classes are when similar features are assigned a matching symbol so it is easier to see what the map will look like. You can do this manually or with a classification scheme. It is also beneficial to compare different schemes to find out which one would be best for your specific map. The section that compares the different schemes and explains each of their uses helped me a lot with understanding classes as a whole. A lot of the information in this chapter reminded me statistics. The classes, quantities, and outliers all reminded me of graphing for stats. The most important takeaway I took from the assigned reading this week came from the “making a map” section of this chapter. It laid out numerous examples, the advantages and disadvantages of each type and what each type is most used for. Since there are so many terms and things to remember when it comes to GIS, I think I will end up utilizing this chapter throughout the semester.  This chapter incoorporated the terms introduced in the two previous chapters and brought it all together.

Henderson Week 1

Hi! My name is Camryn Henderson, and I am a freshman. I am an Environmental Studies and Theater double major with a minor in Politics and Government. I am from Wadsworth Ohio, which is near Akron.

2. Schuurman reading

This chapter was an introduction to GIS, but instead of being a guide on how to use it, it instead it dove into why it is used, the best applications for it, and explained its importance to not only geography but all areas of study.  Before reading this chapter, I was unaware of the problems that can occur from using GIS, and I didn’t know that there could be significant faults in using it. I also found the history of GIS interesting, as I feel it gave better insight into what the program is used for and showed a clear difference between GIS now and originally. I did not not know much about GIS in general before reading this and I found that it gave a good overview of the general knowledge needed to do well in this course. I did not know that there was a difference between “mapping” and “spatial analysis” but learning about the differences between the two was super interesting. Spatial analysis is a term I have heard come up a lot in Environmental Science classes so learning a little bit more about what it is and vast amount you can learn from it was helpful. I chose to take this class not only to fulfill a requirement but also because as I have been doing research for internships, and possible future jobs I have noticed how important it is to be familiar with GIS, and spatial analysis; however I knew very little about what kinds of things I could use GIS for, and this book gave me more insight. Other than for urban planning and other environmental focused careers, I had not heard of GIS being used; however it can be used for sales, transportation, and health professions. This chapter provided me with baseline knowledge that I will be able to use throughout the semester.

3.  Buruso, F.H. Habitat suitability analysis for hippopotamus (H. amphibious) using GIS and remote sensing in Lake Tana and its environs, Ethiopia. Environ Syst Res 6, 6 (2018). https://doi.org/10.1186/s40068-017-0083-8

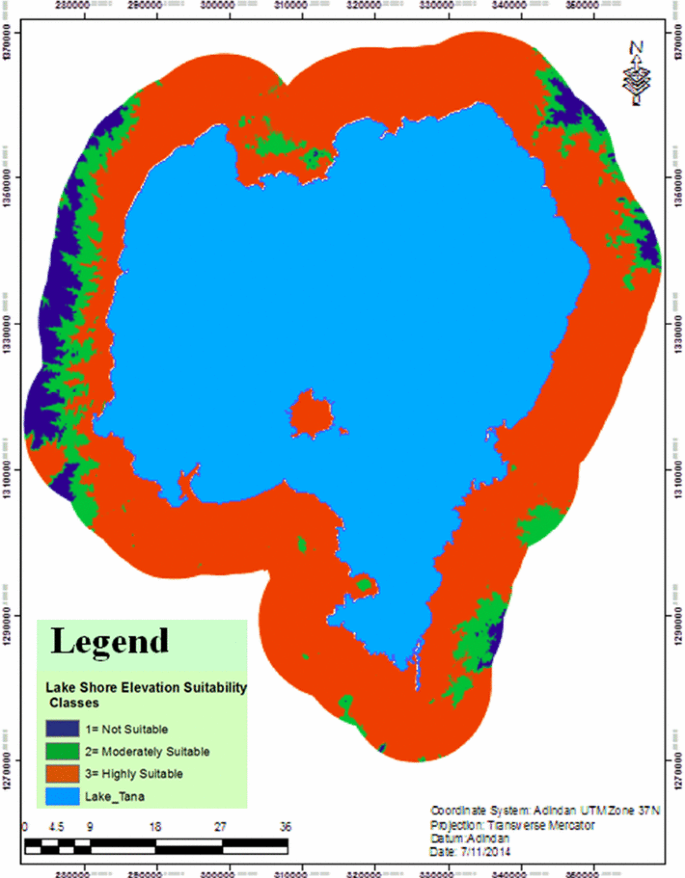
figure 4

This is a GIS image of the elevation sutiability for hippos in Ethiopia near Lake Tana. In the article where I found this analysis I found many others, all covering different criteria and their respective suitability. They were able to reclassify the data and determine suitability by elevation in this case.

Sarma, P. K., Mipun, B. S., Talukdar, B. K., Kumar, R., & Basumatary, A. K. (2011). Evaluation of Habitat Suitability for Rhino (Rhinoceros unicornis) in Orang National Park Using Geo-Spatial Tools. International Scholarly Research Notices2011(1)498258. https://doi.org/10.5402/2011/498258

Details are in the caption following the image

This image is from a similar study to the first one; however, this time it was focusing on the conservation of rhinos.  Due to rhinos being endangered it is very important for their habitats to be as preserved and suitable as possible. This study focused on suitability in different parts of a National Park in India.