Duncan- Week 3

Chapter 4:  Chapter 4 talks about map density and the importance of it. Map density is useful when mapping areas on a census or in areas in which vary greatly with size. It explains that in order for you to map density you use shades and the denser a population of whatever it is that you are mapping the darker it is. This chapter explains the differences between map features and feature values explaining t hat essentially the feature is what something is and the feature value is kind of like an adjective for the feature where it is just something that further describes the feature. It explains a couple of ways in which you can map density, the two ways in doing so are mapping density by defined area and mapping density by density surface. The density by defined area is used by mapping dots on the map and is largely considered to be less informational than mapping by density surface which uses blob type images. This chapter explains that you can compare areas to find something that reaches the goal of your map. One major thing this chapter tells you how to do is create a surface layer. These surface areas show you where about the points or line features are concentrated on the map that you are creating. It explains that the GIS calculates density by taking the cell size, search radius and units into account when mapping.

Chapter 5: This chapter explains the reasons in which we map the contents of the area in which the map is surveying. This is helpful regardless of if you are mapping single areas or many different areas at the same time knowing what exactly it is that your map is showing is extremely important. When you are defining what it is that lies within the mapped territory it is important that you summarize the information that you need and/or combine your map features with the area boundary and that in itself will create a summary of your data. Your data will consist of what? That is an important question before you summarize. What features are going to be in this map, what is it that is important for the audience to know? Another question that you will have to ask yourself is, are you features that you have created due to those data points going to be discrete meaning that they are unique and can be easily identified, or continuous which is a seamless representation of that data with no specific point?  After you have asked those questions you will need a list, count, or summary to get an idea of what is inside of the area you are going to map. It explains whether or not you want to show feature of your map that are partially outside of your focused area or whether you would just map partial features like portions of rivers and other large features that could span a large area.

Chapter 6: This chapter explains that you should also map what is nearby your specified area this is because it is nice to know the travelling range to places. The traveling range to areas within your map are measured in distance, time, or cost. This is helpful for when you want to make a map that is explaining the distance from another feature the example in the book is streets within a three minute range of the local fire station. So for other maps that have that same type of purpose it is important to know how to calculate the distance of things from each other and the distance between features on your map. You can define distance or nearness based off of a feature’s travel costs. Something that it explains is that your maps come out in a way that is presented as flat. So, your information will be slightly skewed just due to the curvature of the earth’s surface. So the maps will contain something of a straight line distance which you get from specifying your distance and source feature. This chapter also explains what a buffer is and how you use buffers in order to make your distances more accurate. Basically it has the GIS draw around your distance due to the buffer which leads to more accurate distances. These buffers also show features in which are close to or at least near more than one source of information on the line of distance. Once the buffer is placed you can use the buffer to select features that fall within it.

Duncan – Week 2

After reading Chapters 1-3 here are my notes and major takeaways

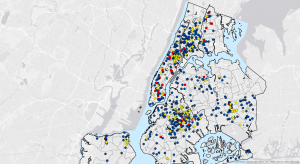
Chapter 1: Is the brief intro to the book and explains some of the major things that you can do with GIS systems. It explains a little bit further as to what GIS is and its uses, both the niche and the most popular uses. This chapter tells us about the most common geographic analysis uses such as Mapping where things are, mapping the most and least, mapping density, finding what is inside of an area, finding what is nearby an area, and mapping change of areas over time. This chapter explains how to implement five crucial steps when performing an analysis, starting with “Framing the Question,” figuring out what you need in terms of the information you are using, and how that information will help your analysis. the second step is “Understanding your Data,” In order for your map to be useful you have to understand the data in which you are plotting out. The third step is “Choosing a Method,” this step is crucial in getting the information you need as there is often more ways than one to do obtain your specific information. So depending on if you need more precise results or if you are just looking for an over arching view of the data your method  in which you get that data varies.  After you have your data, the next step is “Process the Data,” which just means you run your data through GIS. After that you arrive to the last step which is “Look at the Results,” where your data will be displayed as a map, values in a table, or a chart. This chapter explains the differences in many different types of features and how to tell them apart whilst using the GIS program. One of the most important parts of this chapter is that it tells us to make sure our data is all in the same map projection and coordinate systems because if they are not your map will not be shown properly.

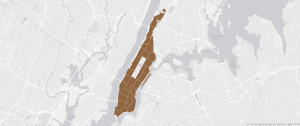
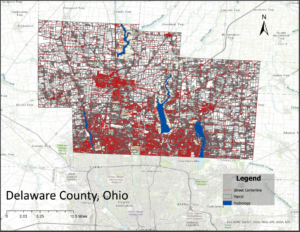
Chapter 2: This chapter talks a little bit more about the importance of having specific data and making sure that that specific data is put into the programs correctly. Having geographic coordinates is helpful because it allows for the GIS system to work rather quickly. However if you don’t have geographic coordinates you can use other forms of location info. So stuff like latitude and longitude lines are helpful additionally sometimes you can use street or road names as a form of locational information. It explains in detail the actual workings of making the map, including deciding which features are going to be included in your map. A question that I would have at this point is it keeps talking about layers and the way in which you program information on those layers, my question is what exactly are layers and how are you supposed to program those layers, I do feel like this will be answered once I start looking at the program but that is a question I have. This chapter also explains what exactly GIS does and how it creates the maps we use by marking the coordinates and connecting them to other coordinates to show the features of the map. Additionally it shows the importance of giving context of your maps when mapping subsets, because without context the subsets are not helpful to the overall map.

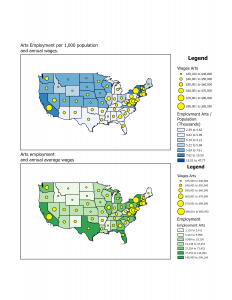
Chapter 3: This chapter explains the importance of mapping comparisons of the least and most parts of the data in which you present to the GIS system. This chapter talks about showing the densities of data as well, which show information in terms of how concentrated info is on the map. Density on maps is highly effective when you are summarizing data the has a vast variety of data points. Another thing this chapter talks about is ranks, putting ranks into your GIS map orders information from high to low or vice versa depending on what you are trying to map out. It explains how even when using ranks you do not really know where each rank should really fall as the ranking system is subjective to the person making the ma and the person reading it. Another topic this chapter discusses is classes and how it is optimal to use classes when the map is going to be used in the public eye as it allows for information to be set beside each other and contrasted easier than if the data was scattered. This is opposed to mapping individual values, which present more accurate values but is harder to actually gauge differences off of. However, mapping individual values allows you to search more for patterns in the raw data. Whereas in classes you are looking more for comparison between things, individual values help you find similarities.


Duncan – Week 1

Hi my name is Braidy Duncan and I am a sophomore this year, and am majoring in Environmental Science.

I did the quiz for this class Geography 291. While reading the first Chapter by Schuurman, I learned some things about GIS that I have never really thought about before today. For instance I never thought about the applications of GIS in anything other than an agricultural sense. So seeing that GIS is used in super niche ways was something very interesting to me. The optimization portion where Ian Mcharg was trying to find the best way to route a highway was something that really peaked my interest as optimization is something that has always intrigued me whether it be the optimization of space or time if you can optimize something it is an amazing feeling. I really like the idea of the first waves of GIS being done without computers and it is something that really baffles me that it can be done in the first place. The map of the Cholera outbreak is really cool to see. Seeing the correlations between the number of cases of Cholera and the water pumps associated to those areas was really cool, and in application it probably allowed the researchers to help put a stop to the outbreak way faster than it would have been stopped without the GIS systems. Something else that I have never thought about was that GIS systems are used everyday.  The different ways in which geographic information can be utilized to help world processes is something that I really look forward to exploring within this class. So having read this chapter I am really excited to see all of the different maps that are out there and really see how far GIS imaging can go and personally I can’t wait.

For my interest in soils I wanted to get to know where I am on a deeper level so I looked for a GIS image of Delaware Ohio.

Source:Delaware County Ohio. (2024, June 27). Cities, Villages & Townships – Delaware County. Delaware County. https://co.delaware.oh.us/cities