Saeler- Week 3

Chapter 4-1 importing data into a new ArcGIS Pro project
– create project
–Open Arc project, under new project click map then determine name and location and ok it
–save project as (tutorial4-1YourName)
-set up folder connection
–use folder connections for quick and easy access
–open catalog pane- expand folders expand youth pop- add folder connection- browse to chapter 4 file add MaricopaCounty to box and ok
-converst a shapfile to a feature class
–shapefile is a spatial data format for a point, line, or single layer polygon
–on analysis tab in geoprocessing group click tools- in georprocessing pane search for export features(converts shapefile to feature class)- for input features click browse then expand folders select desired and ok- for output feature class type cities (for this instance)
-import data table into file geodatabase
–verticle columns have attributes names, describing data in column
–horizontal row represents a census tract
–export data tool
-use database utilities in catalog pane
–create, copy, rename, and delete file geodatabases and anything else in the catalog pane
–deleting tables and feature classes from a file geodatabase is permanent however recoming a layer from contents pane only removes it from map
4-2 modifying attribute tables
-delete unneeded columns
–in contents click tracts then data design then fields- this view allows to create and modify fields in a table- hold ctrl while selecting then restore anything you dont want to delete then save to finilize deletion
-add field and populate it using calcculate field tool
–for census data must retrieve from actual website then add census areas and join datta tagble to shaprfile attribute table bsed on geocode to make file managable-ensure both tables are able to be joined with no leading zeros in file id
-file joins arent permanent to do so export features
4-3
–linking tabular data to the spatial features in feature classes.
–linkage allows symbolize maps using the attribute data
-data range queries

  • queries often use date-range criteria
  • 4-4
    • aggregrating data with spatial joins
      • aggregation of piont data requires a spatial join
  • 4-5
    • Arc creates central points on the fly and renders them as point features if graduated symbols for symbology is chosen
  • 4-6 creating a new table for a one to many join

Chapter 5 spatial data

  • 5-1 working with world map projections
      • geographic coordinate systems use latitude and longitude coordinated for locations whereas projected coordinate systems use a mathematical transformation from an elliposid to a flat surface and 2d coordinates
    • examine a world map in geographic coordinates
      • distortions are caused by displaying a map in geograaphic latitude and longitude coordinates
    • project the map on the fly to hammer-aitoff
  • 5-2 working with us map projections
      • you can either get accurate areas or accurate shapes and angles but not both
    • setting projected coordinate systems for the united states
  • 5-3 setting projected coordinate systems
      • for medium and large scale maps use localized projected coordinate systems tunded for the study area and that have little distortion
    • look up a zone in the sate plane coordinate system
      • state plane coordinate system is a set or coordinate systems that seperates the states and its territories
    • add a new layer to set a maps coordinate system
      • 2 options- add a layer with a coordinate system to a blank map, set a default  coordinate system for all new maps in a project
    • add a layer that uses geographic coordinates 
    • change a maps coordinate system
      • us developes the universal transverse mercator grid coordinate system it covers the worl dwith 60 long zones defined by meridians that are 6 defrees wide 
  • 5-4 working with vector data formats 
    • examine a shapefile 
      • many spatial data suppliers use the shapefile data format
      • shapefile consists of at least 3 files- shp(geometry of features), dbf(attribute table), and shx(index of spatial geometry)
    • import a shapfile into a file geodatabase and add it to a map
      • use conversion tool to convert a shapefile into a feature class and store it in a file geodatabase
    • x,y data
      • GPS units and many databases provide aspation coordinates as x,y coords
    • convert a KML file to a feature class
      • kml is file format ssed to display geographic data in many mapping allplications
  • 5-5 working with us census map layers and data tables
    • dowlad census TIGER files
      • when using census data or frequently updated data ensure use of correct time period
    • Dowload census tabular data
    • process tabular data in excel]
      • you can use excel to clean up dowloaded data making it easier and more accurate to use
    • add and clean data in arcgis pro
    • join data nad create a choropleth map]
  • 5-6 dowloading geospatial data
      • many government organizations display their data on public websites such as DOC, NASA, EPA, etc.
    • Add a land use layer from arc living atlas
    • extract raster features for hennepin county
    • Dowload local data from a public agency hub
      • many local agencies supply spatial data through open data portals or hubs

Chapter 6

  • geoprocessing
        • a framework and set of tools for processing geographic data
    • 6-1 dissolving features to create neighborhoods and fire divisions and battalions
      • examine the dissolve field and other attributes
        • pairwise dissolve tool needs a dissolve field for combining block groups 
      • dissolve block groups to create neighborhoods
    • 6-2 extracting and clipping features for a study area
        • tutorial is a workflow for creatinga study region from layers that have excessive features
      • use sselect by attributes to create a study area
        • study area is important when working geogrpically dense areas like NYC with streets and blocks
      •  use select by location to create study area block groups
  • 6-3 merging water features
    • merge features
      • use merge geoprocessing tool to create one water feature class from 5 seperate classes
  • 6-4 appending firehouses and police stations to ems facilities
    • append features
      • use append tool to append firehouses and police stations to already exisiting ems points 
  • 6-5 intersecting features to determine streets in fire company zones
    • open tables to study attributes before intersecting
      • observing attribute tables of each feature class familiarizes you with attribuetes before intersecting features
    • intersect features
      • use pairwise intersect tool
    • summarize street length for fire companies
  • 6-6 using union on neighborhoods and land use features
      • union tool overlays geometry and attributes of 2 input polygon layers to generate new output polygon layer
    • open tables to study attributes
    • use union on features
    • calculate acreage
    • select and summarize residential land use areas for neighborhoods
  • 6-7 using the tabulate intersection tool
    • study tracts and fire company polygons
    • use tabulate intersection to apportion the population of persons with disabiltes to fire companies

Saeler week-2

Chapter 1
-GIS has grown greatly even offering new sources (Lidar and drones).
-Greatest change for better is larger amount of people doing spatial analysis and sharing results offering more data than ever
– GIS data easily accessed by sites such as ArcGIS Living Atlas of the World
– GIS analysis is a process for looking at geographic patterns in your data and at relationships between features
– To start gis analysis figure out what data you might need then think through a question (usually). Try to be as specific as possible. Also consider who will be using data and how they may be using it to flush out your question or data you’re seeking. Than understand what data you need and select the method of analysis accordingly. Finally analyze your results.
-Types of features are discrete, continuous phenomena, or summarized by area
–Discrete- the actual location can be pinpointed at any given spot the feature is either present or not
–Continuous Phenomena- such as precipitation or temperature can be found or measured anywhere. They blanket the entire area you’re mapping. Can determine a value at any location. (weather station)
–Features summarized by area- represents the counts or density of individual features within area boundaries. (for example number of businesses in a zip code). data value applies to the entire area but not a specific location within it.
-2 ways of representing geographic features vector and raster
— Vector model each feature is a row in a table and are defined by x,y locations (address of a business/location of a monument)
— Raster model, features are represented as a matrix of cells in a continuous space (i think weather radar maybe?)
–discrete features and data summarized by area are usually vector model
-Map projection and coordinate systems
–translates locations on the globe onto a flat map. All map projections are distorted. Which distortion can be negligible on small scale but can cause problems when mapping a larger area.
—If collecting data from multiple sources ensure that map projection and coordinate system is the same.
-Understanding Geographic attributes
— Every feature uses multiple attributes including- Categories, ranks, counts, amounts, ratios

—Categories are groups of similar things (help organize data roads can be classified as freeways, highways, or local roads). Ranks put features in order from high to low(nonspecific in value but tells you the order of features such as one may be ranked lower than another but you won’t know how much). Counts and Amounts show total numbers. Counts are number of features on a map. Amounts are any measurable quantity relating to a feature (amount of trees in a thicket of woods/area). Ratios show relationships between two quantities and are created by dividing one quantity by another (dividing amount of employees by number of business locations give avg number of employees per location).
-Working with data tables- common operations performed on features and values within tables are selecting, calculating and summarizing
–Selecting is to select features to work with a subset or to assign a new attribute value. Calculating is to calculate attribute values to features in the data table. Summarizing is for getting specific attributes to get statistics.

Chapter 2

  • Deciding what to map
    • Map the features you are focused on such as a police department mapping crimes
  • Preparing your data
    • make sure all features have geographic coordinates assigned before mapping
      • when bringing in data from another program or when entering by hand features will need specific locations such as the longitude and latitude coordinates.
    • Assigning category values
      • each feature requires code that identifies its type (sandwich: philly, blt, cbr, etc.)
      • to add a category you create a new layer in the layers data table and assign appropriate value to each feature
        • many categories are hierarchical with major types divided into subtypes
  • Making your map
    • Features displayed and which symbols to use to draw them
    • mapping a single type- use same symbol for all features (may suggest differences in feature)
    • using subset of features- can map all features in data layer or subset based on a category value. (can reveal patterns that aren’t apparent when mapping features)(more commonly done for individual locations)
    • Mapping by category- map features by using different symbol to draw features for a different category value. (gain understanding of how a place functions)
    • Displaying features by type- Features can belong to multiple categories and using different categories can reveal different patterns.(can usually display all categories on same map but if features are to close or complex create multiple maps)
      • displaying a subset may show a relation between categories better(no more than seven categories/patterns)
    • Grouping categories- can group categories to limit patterns making it easier to see relationships between features. 
    • Choosing symbols- if mapping individual locations use single markers. use variety of shapes and colors or patterns to help distinguish features making relationships in categories and features easier to recognize
    • Also be sure to map noticeable reference points to make locations more recognizable for other people going over your data such as famous buildings and memorials  or roads such as highways.
    • Analyzing geographic patterns
      • clustered distribution- features more likely to be found near other features
      • uniform distribution- features less likely to be found near other features

Chapter 3

  • mapping most and least- map features based on a quantitative value. Mapping features based on a quantity can reveal a more specific pattern such as instead of mapping cars in a town going into detail and mapping specific brands or types of cars reveals more in depth detail you may be looking for 
  • What do you need to map?
    • by mapping features with similar values it allows you to gain a better understanding of your map 
    • you can map quantities  with discrete features , continuous phenomena or data summarized by area
      • discrete features can be individual locations, linear features or areas
        • individual locations and linear features usually represented by graduated symbols
        • areas shaded to show quantity
      • continuous phenomena can be defined areas or a surface of continuous values
        • defined areas- graduated colors
        • continuous values- graduated colors, contours, or 3d perspective view
      • Data summarized by area is usually shown by shading area based on its value or using charts to show value in an area
    • Creating classes
      • once you’ve determined your quantities determine best way to represent them by assigning each individual value its own symbol or by grouping values into classes (trade off between presenting the data values accurately or by trying to get the most accurate map)
        • counts and amounts and ratios are usually grouped into classes 
        • ranks  are to be mapped as individual values since they are not continuous 
      • Mapping individual values lets you find patterns easier 
      • using classes lets you see features with similar values
      • Use standard classification schemes if you want to group similar values for easier pattern recognition
        • natural breaks-data clusters are placed into a single class and breaks happen between clusters of value
        • quantile- each class has an equal number of features
        • equal interval- each class has an equal range of values(difference in high and low value is the same for each class)
        • standard deviation- each class is defined by its distance from the mean value of all features
        • when dealing with legit outliers put them in their own class, group them together in a class, group them with the adjacent class, or designate a special symbol for them
      • Making a map
        • GIS provides graduated symbols, graduated colors, charts, contours, or 3d perspective views

Saeler Week 1

Hello my name is Braden Saeler. I am a junior majoring in environmental studies. I am from St Marys Ohio.


I have taken the syllabus quiz.  GIS is a very complex tool used by many for a variety of reasons ranging from being used by say archeologists to find potential dig sites. Compared to say Starbucks and potentially other large businesses using it to find the best place to put one of the buildings.  Specifically seen when talking about its inspiration and founding when maps were stacked to help show the best path of travel through terrain. Which also shows another way for it to be used showing that GIS doesn’t have its own identity but rather the intent behinds its use.  It has also greatly shown to be advanced and separating itself from simple mapping by producing a myriad of information. By being able to show elevations and land shaping as well as other details such as flora and fauna giving a much better look into what is truly there. The most important note I have read about however is what GIS can stand for. In the sense of geographical information systems commonly referred to as the Black Box.  This pertains to any and all systems including code, computers, hardware, and software.  Which is different compared to the science or GIScience as referred to in the text. I believe the separation of the two is an interesting take but possibly necessary to bring forth the thought of how for instance the spatial density of poverty in a city is computed instead of simply going along with this computer just makes everything accurate. As well as, asking questions  such as how a certain model holds up in another environments as used in the text how a hydrological model would hold up in a glacial biome compared to the wetlands it was used in. Overall a very interesting read in how GIS has come to be and how it has influenced so much of our lives without us even realizing it.

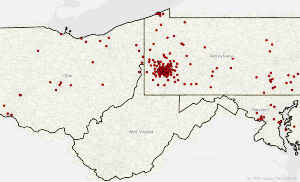
The first example of GIS I looked into would be Ash trees which I have been very interested about especially with how few healthy trees are left after facing an invasive species (the emerald ash borer).  I used Gemini to search for GIS what was provided was it mentioned how invaluable GIS is for species like the Ash trees found naturally in America in tracking previous sightings with the Emerald Ash Borer or EAB. With first being able to map out all Ash trees in a given location. Then providing extremely specific details on said trees for example exact measurements of the tree, if its health, previous treatment, and signs of epicormic shoots or signs of stress in any or all of the trees.  This further proves to be invaluable by being able to easily determine the risk factor of any of the trees to help contain the beetle. Allowing the correct response to be taken to either help or contain said trees in any given area.

Ash loggers race against time before beetles get them all | AP News

https://apnews.com/article/f1e4351ae7f64bc7b278a4e3a533172a

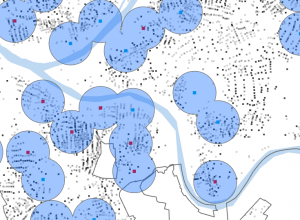
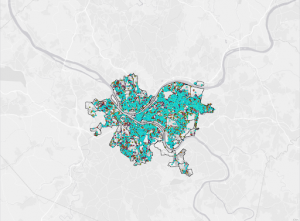
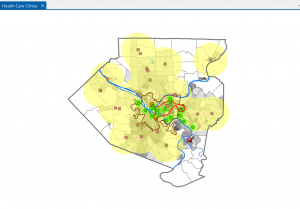
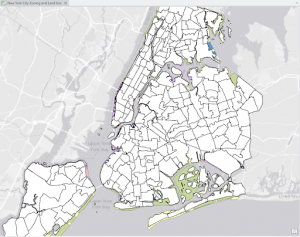
Another study I found interesting using GIS was conducted on something called food deserts. Which is where an area of people have little to no access to fresh or general foods for homes. The study highlighted how covid had truly shown how prevalent these areas are restricting homes availability so good nutritious meals or just in general food to keep stocked at home. They used GIS to help map these food deserts and show how we as a society have left something so detrimental to small communities and impoverish households to run rampant.

Using Local Knowledge to Better Map Food Deserts