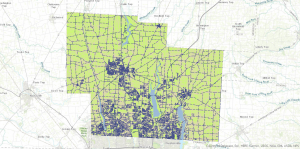
This week, I downloaded the available GIS data layers for Delaware County, Ohio. The three specific datasets I worked with were Parcel, Street Centerline, and Hydrology. Each of these layers provides different information that is useful for understanding how certain things are laid out across an area (Delaware). The Parcel data layer consists of polygon features that represent all cadastral parcel boundaries within Delaware County. The term “cadastral parcel” was something that I was unfamiliar with – it means a piece of land that contains fixed boundaries and is recorded in official land records. Upon further examination of the Delaware County Ohio GIS Data Hub, I discovered that his dataset is maintained by the Delaware County Auditor’s GIS Office and is based on officially recorded documents from the Recorder’s Office.
The first layer I downloaded was the parcel layer. This layer is updated daily and is commonly used for property assessment and boundary mapping. Specifically, the layer provides an accurate representation of how land is divided throughout the county. The next layer downloaded was the Street Centerline data and it shows the centerlines of both public and private roads in Delaware County. This data is spatially accurate and is updated frequently to reflect changes in road infrastructure and addressing. Finally, the Hydrology data layer is a representation of major waterways within Delaware County, including rivers and streams. The hydrology layer is useful for understanding drainage patterns, as well as the relationship between land use/water resources. After downloading the Parcel, Street Centerline, and Hydrology datasets as shapefiles, I created a new ArcGIS Pro project and added all three layers to the map. Displaying these layers together allows for a better understanding of how parcels, roads, and waterways interact spatially across the county. This was a pretty easy map to create, and I got to choose my own colors for the symbols which was enjoyable.