Chapter 7
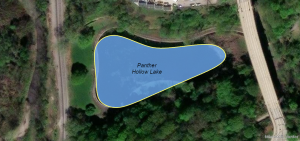
Chapter 7 introduced the practical processes involved in editing and creating spatial data. It emphasizes that GIS is not simply about viewing maps but also actively maintaining them as well. Through moving and reshaping polygon features of the campus, it became clear to me that spatial data must continuously evolve. The ability to edit vertices and create new feature classes such as parking lots and bus stops seemed quite interesting to me. I found applying the Smooth Polygon tool to be easy and the end result of it aesthetically pleasing.
Chapter 8
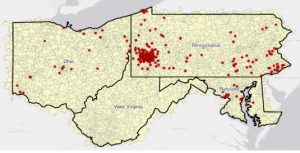
Chapter 8 explored the process of geocoding, which connects tabular data such as addresses and zip codes to geographic locations on a map. The only part I found interesting in this reading was the process of reviewing matched and unmatched records – was almost like a puzzle. It demonstrated that GIS analysis depends not only on automated tools but also on critical evaluation. This chapter emphasized that spatial accuracy directly influences the validity of conclusions drawn from mapped data. The consequences of having incorrect mapped data could affect overall public safety, or even service delivery. Moving on, the buffer analysis tutorial around public swimming pools in Pittsburgh taught me how juxtaposition plays a role in accessibility. This idea particularly applies to youths living within a half-mile radius of recreational facilities – in other words, the pools.
Chapter 9
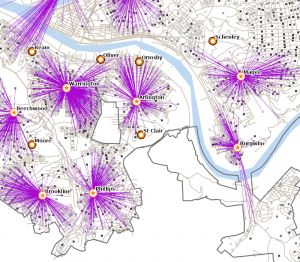
This last chapter focused mainly on spatial analysis, specifically showing how GIS can move beyond simple mapping. Using buffer tools around public swimming pools in Pittsburgh, I calculated how many youths live within a half-mile of a pool. Afterwards, I calculated what percentage of the city’s youth population that represents (I am thankful I don’t have to do actual calculations. This made the concept of accessibility much more believable, especially when thinking about how distance affects whether someone will realistically use a public facility. With this in mind, I can see how it is important to look at maps such as this in order to acquire the most efficient spot for a public facility. It also became clear that straight-line buffers do not always reflect real travel conditions. It is not accurate when terrain and bridges are not included. My thoughts for this chapter include knowledge of how GIS can support planning decisions, such as which public restrooms to shut down because of low funds. It is advantageous because it can turn spatial data into measurable series, ones you can apply to real-word problems.