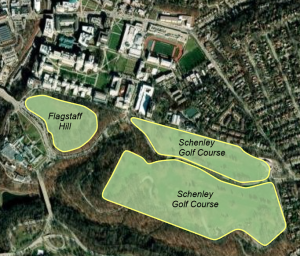
Ch 7: This chapter focused a lot on how to move, rotate and readjust the shape of certain images. Which reminded me of photoshop and other editing apps used for pictures. In tutorial 7-1., I learned how to move images and make them fit to their corresponding guidelines. At first I struggled with being able to move the selected item, but the book was a great reference to solve my problem. I also struggled with creating polygons in the first part of 7-3., but everything else was fine afterwards. Throughout this chapter, I learned the importance of understanding coordinates and adjusting figures on the GIS maps. Especially when the data is being used to plan or rework an area such as remodeling an old building. Both on the exterior and interior, which is one of the key takeaways I learned from this chapter. For example in tutorial 7-4., I had to analyze the inside space of the Hamburg’s Hall academic building. This activity helped me understand how GIS can be used for interior remodeling or data collection, depending on the research. I believe this is an interesting way to use this technology because it can help architects, engineers or people who use a building to work on ways to improve it. I wonder if this tool is used for any construction or remodeling project on OWU campus. For example, I heard that there is a future solar panel project on campus so I wonder if they used GIS for any planning? Nonetheless, I enjoyed learning how to readjust figures and how GIS can be used for modeling and not just statistical data analysis. This will make the software more fun and interesting to utilize.
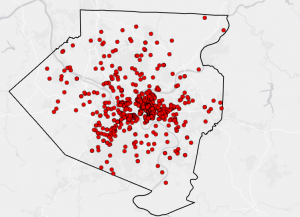
Ch 8: This chapter emphasized the tool for geocoding on GIS. I was surprised to see that the introduction was long and how many mistakes have been made with the geocode. One of the major errors of this process is the misinformation it can create. The introduction mentioned that geocode can interpret misspelled words which can convey inaccurate data. Even though there has been software to solve this problem, it can still be challenging to accurately obtain results. Additionally, I was also surprised to see that this was a short chapter and that there were not a lot of tutorials for geocoding. As the name suggests, these tutorials reminded me a lot about programming because I had to input a lot of information in order to run the feature. In programming, I know that one has to also input specific data and values to obtain the results they want. Another aspect of this tutorial that I noticed was the common use of Pennsylvania as an example. I previously mentioned this in another post, but I am still surprised that New York and Pennsylvania are the main locations we use for these tutorials. I wonder if that was set up so that it would make the data and tutorials easier to understand, or is it just a coincidence? I wonder if in the future tutorials a western state will be mentioned, because I do not recall one being mentioned. Regardless, I enjoyed learning about geocoding and how information learned from the tutorials can be applied on any GIS software.
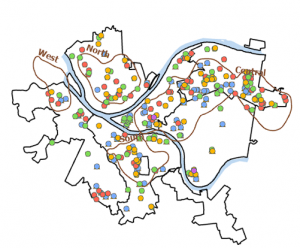
Ch 9: Finally, the final chapter of this week’s tutorial focused on spatial analytical methods of the GIS software, such as buffers. This reminded me of a previous tutorial where it also focused on how to create and apply buffers on the software. However, this chapter focused on the different methods of spatial data so the section was broad and less focused on buffers. It was interesting to see how the distance of buffers can visually change the map. For example, in tutorials 9-1., to 9-4., exemplifies how buffers change the map through colors and shapes. Such as in 9-3., where the buffers added color to the map while representing different data in specific areas. This was also used for the other tools such as the data cluster and network analysis to define certain features and areas. I remember that Schuurman described his concern for misinterpreting data from GIS because everyone has a different perspective. Especially if the data does not use a legend to explain the difference between each color. I wonder if some people would prefer aesthetically pleasing visuals on the map instead of practicality. I know some people are more creative than others so would they have a preference on the colors used for representing the data? Perhaps there should be a guideline on how the colors should be interpreted when using GIS. This question may be out of topic, but it was something that I was curious about after following the tutorial and noticing the different colors used. I really enjoyed this week’s tutorial and I hope to keep improving my GIS and technical skills.