Chapter 7:
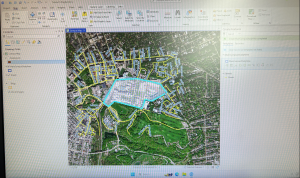
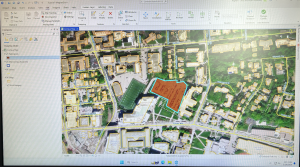
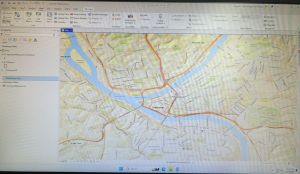
Chapter seven focuses on creating polygon features, digitize point features, using cartography tools to smooth features, CAD drawings, and spatially adjusting features. Tutorial 7-1 has you edit polygon features to select a specific university building. It has you do this feature to multiple different buildings, with complex shapes and sizes. Into 7-2, the focus is on adding a feature class to polygons. Adding a feature class allows for a select tool along the contents pane that can be clicked on and off for each item you want highlighted. In this chapter it focuses on parking lots. The parking lot highlighted below in red was relatively simple. The only slight issue I had was finding how to make the background color transparent. Into the next steps, it showed us how to remove buildings as the map is updated. One thing I noticed about this specific map was it had been further updated since the book and there was another building still labeled that needed deleted. I went ahead and also deleted that one to get the most accurate map, as well as some more practice. Overall, I have noticed multiple times this semester that many steps are not accurate to the book and the wording has changed, or the map within the software. This has lead to multiple moments of confusion for me using the GIS software. The final step of this tutorial was to outline the main campus portion using snapping. The snapping feature was much easier than the previous selecting, and made the shape much more accurate. This was helpful for the next steps when it had you take the measurements. The next few tutorials were very similar with outlining different buildings and landmarks in different circumstances. This chapter was extremely helpful to learn more about the special features of GIS.
Chapter 8:
Chapter eight focuses on learning about geocoding. This includes geocoding zip codes and addresses using streets. The tutorial I did for this chapter was 8-1, however this one took a lot of time and gave me multiple difficulties. The first step was building a zip code locator. I was able to do this, but I was confused on the next few steps when it was having us fix certain zip codes. I was able to get the red circles and view the tables and the data pretty easily, which was helpful in this long tutorial. I also was able to symbolize the dot very easily, this step has been used in almost all of our GIS chapter so far. While I had confusion in the unmatched zip codes, I was able to figure it out. I think the reason some step similar to these has given me confusion over the semester is due to the chapter not clearly explaining the reason behind these steps and what it is really used for. However, the book continues to have clear explanations over. The next few steps had us using the same tutorial data, but showing it on different base maps. I liked looking at the separate maps it allows us to use, it was very interesting. The final step was symbolizing using the Collect Events tool. This gave me a lot of trouble this tutorial. I opened up the tool like it said, and attempted to type everything the book states, however the book options were not available and kept failing when I tried to run them. I messed around and used the provided options of what I thought it would be, but each time it would fail and say the folder was wrong. This was another instance I found when the book was not accurate to the computer, and do to not having a full grasp of the technology I did not know how to figure it out on my own.
Chapter 9:
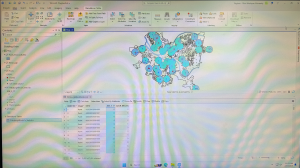
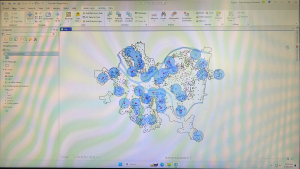
This was the final chapter of this week, and entered the third part of the book that focuses applying more advanced GIS technologies. Chapter nine’s focus was spatial analysis and shows us how to use buffers, multiple-ring buffers, create service areas of facilities, and preform cluster analysis. I focused on Tutorial 9-1 for this chapter. The focus of this tutorial was using buffers for proximity analysis. It starts by showing us how to use the Pairwise Buffer tool, which allows us to find what is in proximity to the feature being buffered. For this one, it has us create a buffer around the pools in Pittsburg. I had no trouble in the first step and was able to create the blue buffer pictured below. This was a really cool feature and made it really easy to visualize where all the pools are. It then had us use block centroids to sum the number of youths. This opened up the teal circles and the graph pictured below. I also had no trouble with this step. For the Your Turn portion of this tutorial, it asked to create a mile buffer around the pools. I attempted this by adding the same commands, but changing Distance to 1 U.S. Survey Mile. This created a new and larger buffer around the blue circles. However, the buffer looked much different from the picture and took up more space which makes me wonder what the correct measurements would be or if anything else needed changed. It moves on and shows us how to create multiple ring buffers using the same data. Overall, this chapter was relatively simple compared to the last chapter.