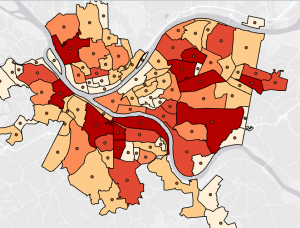
Ch 4: . In this chapter I learned how to create and work with databases. Following along with the rest of the chapter tutorials was much easier this time. Unfortunately I still had some technical issues so I could not complete all the tasks but I managed what I could. I thought it was not a very complicated task, and it reminded me of coding. Especially when I had to add the parenthesis around the crime and robbery in the SQL tab in tutorial 4-3. As well as having to create phrases such as the “where… is equal to…” in the attribute tables. I believe that while coding, one has to be very specific about the data and the output it would create. Otherwise the data could be misinterpreted or the visual could come out wrong. Out of all the chapters, I believe that this was the easiest tutorial for me. I enjoyed adding colors and symbols to represent the crimes. Although, it was a bit disappointing to notice all the crimes committed in the Pittsburg area on the map. Using GIS was a great tool to analyze these social issues, but I’m assuming this is not the first time GIS has mapped crimes or other city problems. I am unsure if the data is outdated but I wonder if the crime rates have gotten worse, and what is the city doing to reduce crimes? Hopefully the same GIS software can be used to identify possible solutions to these crimes but also for other issues a neighborhood or area may encounter. Overall, I enjoyed this chapter especially tutorials 4-3 and 4-4, not only creating the data but as well as reading and understanding the maps. Particularly when the maps include important data regarding social issues such as low healthcare accessibility or low family income in certain neighborhoods.
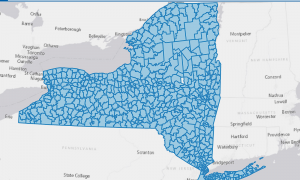
Ch 5: Using the GIS software to develop world maps was a fun tool, and converting it into a sphere was interesting. This chapter was a good reminder of how to read maps using longitude and latitude coordinates. Mostly because I rarely use map coordinates so this was a nice skill to refresh especially for the GIS software. For the majority of this chapter, I understood the instructions more which made the process quicker and easier. I learned the importance of having coordinates in order to comprehend the data in certain areas such as the bicyclists in tutorial 5-5. I also learned that spatial data is easier to modify and change which is helpful in order to make map data accurate. Especially if borrowing data from other sources such as the data from the census website in tutorial 5-5. Throughout this chapter I learned how different types of maps can show different types of data. The tutorials throughout the chapter, used contours, raster, coordinates, and world maps to demonstrate different data. Sometimes these maps were used to show the same data in different ways. This reminded me of the other textbook where it explained all these different features and types of maps. It was interesting to see them into practice and how each map contributed differently to the data. However, I wonder why most of the map locations are normally from New York? I noticed that in other tutorials such as chapter two and chapter six, New York was also used as a reference. I am assuming that it is because New York has a large population so more data may be available, but I thought it was interesting. Nonetheless, I enjoyed being able to elaborate on previous data from the census website and use different maps to compare the data in similar areas.
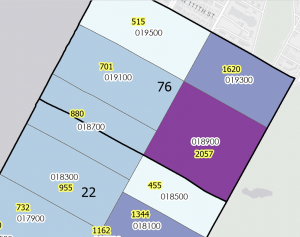
Ch 6: In this chapter I learned about geoprocessing, which was something I was unfamiliar with before this tutorial. I also learned about the Pairwise Dissolve Tool which helped block attributes to their neighborhood level using statistics. I also learned that the Pairwise Intersect tool can summarize feature class data together into a group. Furthermore, I learned how to use the Union tool to create a polygon layer and how to combine it with the Intersect tool. It was interesting to see how multiple tools and features came together to change the map output of certain data. For example, in tutorial 6-7, I had to use the Tabulate intersection tool to identify the number of people with disabilities. I put into practice my previous knowledge from the other tools to navigate the tabulate intersection tool. Being able to understand the process of finding and using tools made the tutorials faster. It also helped me to quickly identify what I needed to do and where to find these features. I learned how to use the toolbox tool as well as these specific features throughout the chapter. Although, sometimes I would not find a specific tool, so I had to use the search bar which made the tutorial much easier to follow. At the end of this week’s tutorials I feel like I have gotten better at understanding and using the software. I feel more comfortable navigating the tool and tabs, as well as identifying certain features on a map. I was also able to put into practice some of my map, statistics and technical skills throughout each tutorial. As I previously mentioned, I still had a few technological issues, but it was less compared to last week. Hopefully I will keep honing my GIS skills throughout the remainder of this course and especially for the final.