Chapter 1 Tutorial
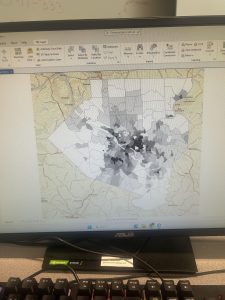
Starting off, this chapter was very confusing for me. I logged in on GIS online at first, but quickly found the GIS Online shortcut on the desktop and this quickly resolved all of the issues. Moreover, I downloaded the tutorials online, but forgot to extract it. I had issues trying to figure out where the chapter 1 tutorial was, but I reread the instructions and realized that I had forgot to extract the chapter files. I found this tutorial very interesting as it relates to public health, because the locations of urgent care clinics are important to reduce mortality. This is a great way for public health officials and policymakers to see where locations are needed, so they can advocate for the construction of more clinics in areas of need. I also found it very interesting how you can look at various factors- like population density, poverty risk areas, and households per square mile. This visualization also allowed me to realize that healthcare clinics are usually placed where the population desntiy is highest, which means that areas of lower population density have lower accessibility to health care clinics. I found the book to be very helpful and was very straightforward with instructions, which I appreicate as GIS is a brand new skill for me. I had learned valuable skills about feature class, raster dataset, a file deodatabase, and a project. Moreover, I learned how to bookmark, locate contents in a panel, how to save a project, how to add and remove a base map, and how to turn layers on and off through contents pane. After completing this chapter, I feel more comfortable with what GIS is, and I feel less anxious and overwhelmed while working. I am happy that I was able to experience the basis of GIS and start honing my skills in hopes I can apply this to my future profession.
Chapter 2 Tutorial
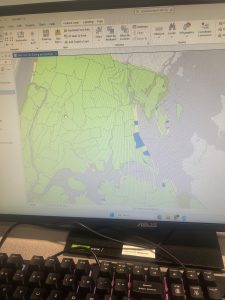
For this tutorial I was able to choose layers for a thematic map through a New York City Zoning and Land Use Map. Thematic maps consists of a subject layer or layers (the theme) placed in a spatial context with other layers, such as streets or politicla boundaries. This allows the viewer to see many elements at once, for example, during this tutorial I saw: commercial, manufacturing, park, residential, residential/lt mtg, and waterfront zoning land use all at once based on different colors. The first part of the tutorial was very interesting, as it was interesting to see the contrast between colors and how we can make use of aesthetics. I had a lot of fun with this, and futher went on to play a lot more with the colors. I did have issues with the water not turning blue. Tutorial 2 wa about labeling features and configuring pop-ups, which are used to identify graphic elements and/or detailed information and included data from several fields, as well as possibly images and charts. I also learned about what a defintiion query is, which is used to filter the features of a layer rather than select a temporary subset of eatures to work with, even though they both use a similiar SQL interface.
I found this tutorial to be fairly straightword, and I enjoyed participating in the “your turn” sections, as it was challenging and allowed me to connect prior steps and definitons from the book into practice. This tutorial did not take too long, and I found it very interesting. I really enjoyed creating choropleth maps for households recieving food stamps. It was interesting working with US Census Bureau data, as I have never worked with that dataset before, but I forsee myself using it in the future.
Chapter 3 Tutorial
Chapter 3 is about sharing maps with people who do not have ArcGIS Pro or GIS skill beyond map navigation. Tutorial 3-1 focused on building layouts and charts. I found this to be the hardest tutorials, as I got stuck on creating a layout and adding maps to it. After consulting help, however, I quickly understood what was going on and was able to move-on. This section was particularly important for creating charts, inserting legends, and adding guides and snap maps to the guides. Tutorial 3-2 was interesting as we were able to utilize ArcGIS Online. I noticed a grand difference between ArcGIS Online and ArcGIS Pro. ArcGIS Online is very useful for smaller projects that require a laptop, and ArcGIS Online is useful for larger projects that may require lots of detail and must be done on a desktop. Tutorial 3-3 was my favorite, because I can see myself creating a storymap through ArcGIS StoryMaps. I have utilized this software before, but I did not realy recnognize its importance. ArcGIS StoryMaps allows you to create briefings that consist of a series of slides with bulleted talking points, interactive maps, and other content for a presentation to an audience. Also, this can be shared online with others through a URL- while it may be more difficult to share a project on ArcGIS Online with somebody who is not familiar with the software. I particularly enjoyed this section, because it combined everything we have previously learned and talked about and allowed us to apply it. Overall, this chapter allowed me to see the more accessible side of GIS and how it can be shared with others. My favorite part of this chapter was creating statis maps with map surroundnigs and the online interactive maps through ArcGIS StoryMaps. Overall, I am excited for next week to learn more about GIS and how this can be applied to public health.