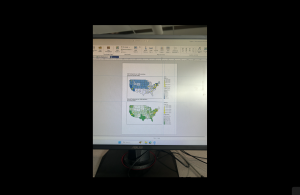
Chapter 1- Tutorial 1.1
This tutorial was the easiest, and relatively self-explanatory in my opinion. However, it took much longer than needed as I started figuring out the software and where everything was. I also had trouble with connecting my hard drive into the computer to save, but ended up figuring that out with some help from a classmate. Once I got through the set up portion of GIS it was much more smooth sailing. The actual tutorial began by showing how to overlay maps with the other included data in Allegheny County. What I found interesting was how you could clear everything that is outside of the map to just show what is inside. It made it much cleaner to look at. This reminded me of the previous chapters read of how when creating a map it is important to think about the audience and what would be easy for them to understand. This map ended up being very easy to read and understand while I was constructing it. The left sidebar that lets you turn the specific layers on and off. For this one specifically, it had you select the Urgent Care Clinics, FQHC Clinics, and Poverty Risk Area, as well as the landforms and streets in the area. It also lets you reorder to have specific layers be on top of each other. One part I had trouble with here was right clicking rather than left clicking and the difference between the two. The book was very helpful in explaining when right clicking was needed for the next step. One specific question I had during this tutorial was how the data was already included into the system. I was wondering if we will be shown how to input our own data in the future of this class. Overall, this chapter was explained very well in a step-by-step manor that allowed me to create the graph inputted below.
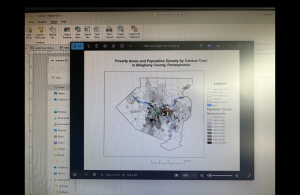
Chapter 2- Tutorial 2.1
This tutorial was my favorite of the three done this week. I liked all the customization options and colors shown to put onto the graphs. I really liked how we did the whole process ourselves of going from a blank, black and white map to the colorful one inserted below. I also found it interesting how you can change the border thickness, color, and even the color of the water. While doing the extra step of choosing the water color, I scrolled through and saw all the different customization options, and I enjoyed seeing all the options it gives. I thought this was a really cool way to get the information across in a clean way. This part of the chapter left me wondering how GIS is able to know the information and tell what is land and what is water. My guess is that is has something to do with the information inputted into it for each tutorial and the data behind the scenes. However, I found it extremely convenient that the software is smart enough to already know the options that can be selected. The only issue I had at this point was knowing where everything was. The coloring step was very repetitive, but I still needed to refer back to the instructions multiple times to remember where everything was. Into the next few tutorials of this chapter it showed how to label different features, create a definition query, and create a choropleth map. When adding the labels, I liked how they used the pastel colors, gray borders, and bold labels. This made the map very aesthetically pleasing, and it was easy to see each of the components. This chapter was a lot more complex than the previous two, but I was able to complete it in less time than the last one.
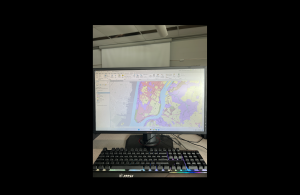
Chapter 3- Tutorial 3.1
This tutorial was the hardest one of the three in my opinion. This one took more time than the last two tutorials together, and was not super smooth sailing. I first had trouble with getting the two specific maps and accidentally grabbed two of the blue ones multiple times. When deleting to try and get the green, I accidentally deleted the new layer portrait and had to completely start over. To do this I had to delete the entire tutorial and resave a new one from the original chapter three folder. Once I got back into the new tutorial, I had an easy time redoing it and going back into the New Layout tab to select the size for the background the maps are placed on. I also was having trouble getting the maps into the right spot, before I realized that the rulers are available to use. Once I put the guides in, looking at the picture and the rulers made it a lot easier to get the pictures into the place the tutorial wanted. I also liked how you could go to each specific map and choose the specific dimensions rather than guessing on the size. I also was confused on whether or not I did the Legend right. I think I did it right, but I moved on to the next part of the steps. The easiest part of this map was adding the text above each map, I had no trouble with this part! That was the last step I did on this tutorial after being frustrated by all the mistakes and troubles I kept having. However, I read the rest of the tutorial and the next steps made sense on how to continue. This chapter had multiple examples that I would not expect to be done on GIS, and it was really cool continuing to see all the options and customizations that are possible. Overall, in the three chapters this was a good introduction to GIS and the software. While I had lots of confusion, most of the steps were understandable with the steps in the books.