Chapter 1:
I Learned about a feature class, a raster dataset, a file geodatabase, and a project. I learned more about ArcGIS as a system and what the tutorials that we are doing are helping us understand and determine. For chapter 1 specifically, I worked with finished ArcGIS maps centered around Urgent care clinics in Allegheny, Pennsylvania with a total of 4 tutorials that I had to run through. Starting with tutorial 1, I learned how to do a myriad of skills including understanding what a book mark is, location the contents pane as well as what is means and includes, and learning how to save a project so that the information you started and worked with is collected on your device if needed for future use. I then learned how to add and remove a base map as well as the definition of what a base map is and how it is utilized in ArcGIS. I learned how to turn layers on and off through using the contents pane and subsections within that. In the first tutorial, I had a lot of issues exporting a map layout to my computer because I wasn’t using a desktop. This was my first time using a lot of these skills so a big part of my experience was trial and error as well as annoyance that I think was warranted, whether that be at my computer, the instructions, or honestly myself for choosing this course. A good outcome out of this is that because I figured out different skills and methods to doing things, I was in turn able to help others that were also confused on what to do or how to do something when it came to starting up the app or the assignments. I had issues opening up and using the 3D map on my computer after it had worked perfectly the first time so I had to do that work at a later time throughout the week in the GIS computer lab.
Chapter 2:
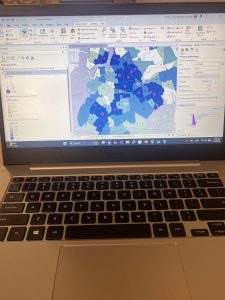
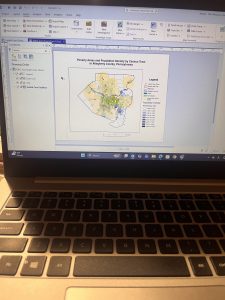
In chapter 2, I learned more about map design and specialization through 8 different tutorials. This chapter was centered around thematic maps with some 3D map usage in a chapter that I had trouble opening on my computer. In these tutorials, I worked with classifying data through codes with qualitative values including low, medium, or high, with the values being mutually inclusive. In the first tutorial, I used symbology through colors as a way to show differentiation and detail within the maps. In tutorial 2, I labeled features and used pop-ups as a way to identify graphic elements like the names of neighborhoods or bodies of water. I had to specify font, size, color, and placement through labels that are created from attributes which are an important part of cartography and information in a map. I learned how to filter and create definition queries as well as how Definition Queries differ from Selection By Attribution, with a definition query being used to filter layer features as opposed to selecting a temporary feature to then work with. In tutorial 4, I learned how to create choropleth maps for quantitative attributes which are needed to break a numeric attribute into fewer or less classes. In order to symbolize map features, you only need the maximum set of values (breaking points). In this example, I made a choropleth map showing what households are receiving food stamps. In this chapter, It seemed a little easier to navigate the app and understand where things were and how they were supposed to be used in correlation to what the instructions were telling me to do. I did have issues at times when trying to complete the your turn section and having to relocate all of the information that I was taught, having to look back in the chapters and even resort to google when I couldn’t find the answers I needed. I will say that I am a bit scared or apprehensive about having to make maps of my own after learning about what they entail and all of the steps I will have to take.
Chapter 3:
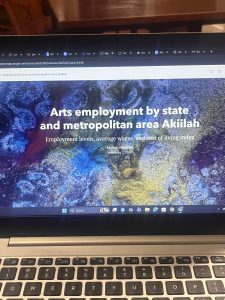
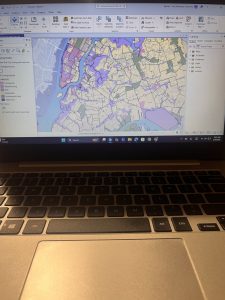
In this chapter, I learned about how to build layouts and charts, how to share maps in ArcGIS online, how to utilize ArcGIS story map, and how to use the arcGIS dashboards. This chapter seemed pretty full circle through using the knowledge of what I learned in past tutorials in the first tutorial of chapter 3, as a means to make a layout and legend for data that someone else transfigured. This chapter was based around how you format and share data with other people, whether that be simply through your work or what sites you present said work on as a means for others to understand, analyze, and observe. I first learned how to build layouts and charts in chapter 1 through map framing and placement. I didn’t find this particular assignment as hard as I thought I would. When I had read that we could be inserting a map and displaying it on our own, I got scared that maybe ArcGIS pro had loosened the reins a bit too far, especially for someone who still gets confused about the contents pane and how to structure the layout of pictures. In this tutorial I also learned how to structure and place legends that correlate with maps, though I’m pretty sure I messed up on the second map legend because it somehow ended up being vertical instead of horizontal and I had no idea how to fix it. In tutorial 2, I learned how to share and publish maps online through web maps. In tutorial 3, I learned how to create stories that include text, maps, images, videos, and other things. These are intended to be read by individuals. Through using ArcGIS storymaps, you can create briefings that include a series of slides that have short talking points, interactive maps, and other content that is used for showing work to others. It was really interesting to see and understand the work that goes into creating and posting maps with data that you’ve collected (even if for these examples, I was using pre-collected data and maps).
( I accidently skimmed over the fact that I had to add pictures so I only added 1 for the first 2 chapters, and 2 for the 3rd one)