My name is Natalia Mason, and I am a freshman studying Zoology (B.S) and Environmental Science (B.A) at Ohio Wesleyan University. I am very passionate about Entomology, Zoology, and Environmentalism. As for my career, I aspire to become an international wildlife biologist, with a specialization in Entomology, so I can make a positive contribution to preserving the ecosystems and species of our planet. Furthermore, I also aim to become a professional author and painter, so that I can use my skills to contribute to the environmentalism movement. I also really enjoy talking about insects and other types of arthropods!

Schurmann Reading:
GIS is integrated into many more real-world data analyses than I had previously thought, although, after learning about it, I have grown to see how critical it can be. Going into this class, I knew of ArcGIS as just a mapping platform; however, the reading had allowed me to see the variety of uses that the mapping platform can be used for among professionals, and I found the description of it being a “scientific approach to a problem” (Schurmann 2) very compelling. It has also made the purpose of GIS clearer by creating a distinction between mapping and spatial analysis.
The article made a frequent point on the uses of spatial analysis in the environmental realm of research, which helped me to contextualize the importance of this application in my field of Zoology. I had seen many distribution maps regarding animals and plants; however, I did not frequently consider the methods that went into creating those visualizations of data. I am realizing that GIS mapping techniques are presumably much more common than I would have thought before.
A point was made that GIS has many roots in older cartography, while conforming into a modern-day digital format that gives the field an opportunity to grow and expand in new ways. It was interesting to learn that the true roots of GIS are harder to gain a definitive understanding of, as it seems pretty fitting for the platform, considering the fact that the range of uses the application has is not static or clear-cut either. The visual aspect of data quantification was made very apparent by the author, which I find to be very important, as it allows professionals to map complex data in ways that can be understood by the public, even when that data is not perfectly clear.
GIS Applications:
The GIS application I found was a Canadian Database that utilized GIS to map the distribution of Mayflies around different watersheds in Canada, as well as a portion of Maine. The Data trends show that mayflies do not venture very far from watersheds. Because they are a species with an aquatic larval stage and a short adult lifespan, they have to stay near waterways to lay their eggs in a short amount of time.
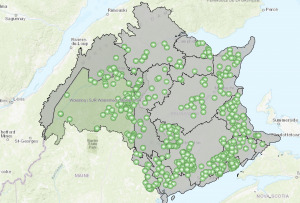
Source: https://experience.arcgis.com/experience/564d07a04cf6472fb367c702ffe3f4d9/page/Main-Page
My secondary GIS application that I had found was a source covering the occurrence of the first stable population of the invasive Indochina Mantis in Italy. The Researchers covering the article had utilized a platform of ArcGIS to map the localizations of the Mantis populations. An interesting aspect of this study looked at railways and how Mantises are likely being transported along the railway to other urban areas across Italy. This data also gives insight into the hardiness of Indochina Mantises within urban landscapes.

Source: https://bdj.pensoft.net/article/50779/
-I have completed the introductory quiz!